A stock pays semi-annual dividends. It just paid a dividend of $10. The growth rate in the dividend is 1% every 6 months, given as an effective 6 month rate. You estimate that the stock's required return is 21% pa, as an effective annual rate.
Using the dividend discount model, what will be the share price?
Bonds X and Y are issued by the same company. Both bonds yield 10% pa, and they have the same face value ($100), maturity, seniority, and payment frequency.
The only difference is that bond X pays coupons of 6% pa and bond Y pays coupons of 8% pa. Which of the following statements is true?
The below screenshot of Commonwealth Bank of Australia's (CBA) details were taken from the Google Finance website on 7 Nov 2014. Some information has been deliberately blanked out.
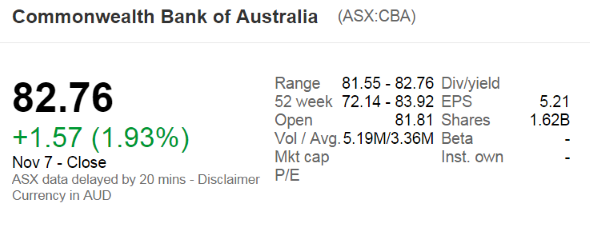
What was CBA's backwards-looking price-earnings ratio?
Estimate the French bank Societe Generale's share price using a backward-looking price earnings (PE) multiples approach with the following assumptions and figures only. Note that EUR is the euro, the European monetary union's currency.
- The 4 major European banks Credit Agricole (ACA), Deutsche Bank AG (DBK), UniCredit (UCG) and Banco Santander (SAN) are comparable companies to Societe Generale (GLE);
- Societe Generale's (GLE's) historical earnings per share (EPS) is EUR 2.92;
- ACA's backward-looking PE ratio is 16.29 and historical EPS is EUR 0.84;
- DBK's backward-looking PE ratio is 25.01 and historical EPS is EUR 1.26;
- SAN's backward-looking PE ratio is 14.71 and historical EPS is EUR 0.47;
- UCG's backward-looking PE ratio is 15.78 and historical EPS is EUR 0.40;
Note: Figures sourced from Google Finance on 27 March 2015.
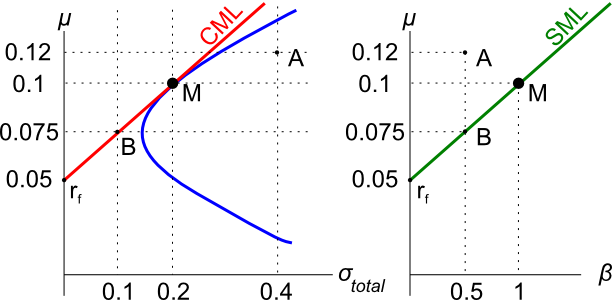
Assets A, B, M and ##r_f## are shown on the graphs above. Asset M is the market portfolio and ##r_f## is the risk free yield on government bonds. Assume that investors can borrow and lend at the risk free rate. Which of the below statements is NOT correct?
Below is a graph of the USD against the JPY and EUR from 1980 to 2015, compiled by the RBA. Select the correct statement about what occurred between 1980 and 2015. Note that in 1980 the euro was around 1.3 USD per EUR and the Yen was around 250 JPY per USD.
A trader sells a one year futures contract on crude oil. The contract is for the delivery of 1,000 barrels. The current futures price is $38.94 per barrel. The initial margin is $3,410 per contract, and the maintenance margin is $3,100 per contract.
What is the smallest price change that would lead to a margin call for the seller?
The below three graphs show probability density functions (PDF) of three different random variables Red, Green and Blue.
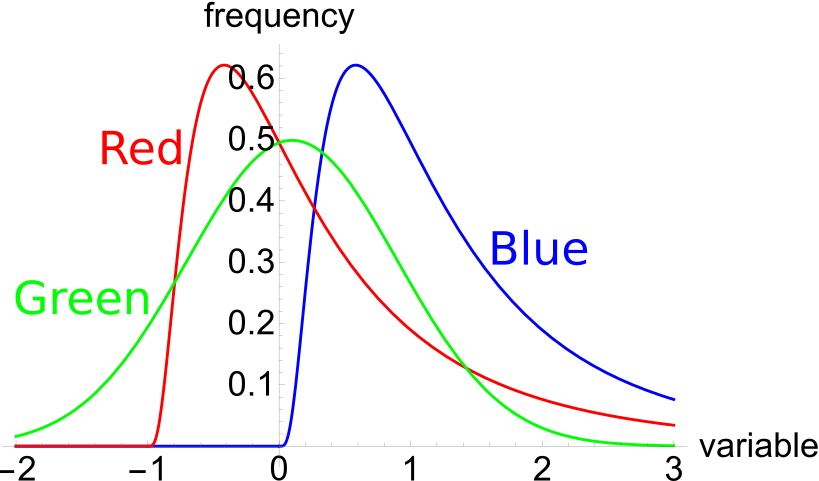
Which of the below statements is NOT correct?
Question 800 leverage, portfolio return, risk, portfolio risk, capital structure, no explanation
Which of the following assets would you expect to have the highest required rate of return? All values are current market values.
Question 894 balance of payments, current account, no explanation
Below are four graphs of Australia's external position, published in the RBA's chart pack.
Assume that all assets and liabilities are debt which makes interest income and equity which makes dividend income.
Which of the following statements is NOT correct? As at the end of 2017, Australia’s: