A stock is expected to pay the following dividends:
| Cash Flows of a Stock | ||||||
| Time (yrs) | 0 | 1 | 2 | 3 | 4 | ... |
| Dividend ($) | 0.00 | 1.15 | 1.10 | 1.05 | 1.00 | ... |
After year 4, the annual dividend will grow in perpetuity at -5% pa. Note that this is a negative growth rate, so the dividend will actually shrink. So,
- the dividend at t=5 will be ##$1(1-0.05) = $0.95##,
- the dividend at t=6 will be ##$1(1-0.05)^2 = $0.9025##, and so on.
The required return on the stock is 10% pa. Both the growth rate and required return are given as effective annual rates.
What is the current price of the stock?
| Portfolio Details | ||||||
| Stock | Expected return |
Standard deviation |
Correlation | Beta | Dollars invested |
|
| A | 0.2 | 0.4 | 0.12 | 0.5 | 40 | |
| B | 0.3 | 0.8 | 1.5 | 80 | ||
What is the beta of the above portfolio?
A retail furniture company buys furniture wholesale and distributes it through its retail stores. The owner believes that she has some good ideas for making stylish new furniture. She is considering a project to buy a factory and employ workers to manufacture the new furniture she's designed. Furniture manufacturing has more systematic risk than furniture retailing.
Her furniture retailing firm's after-tax WACC is 20%. Furniture manufacturing firms have an after-tax WACC of 30%. Both firms are optimally geared. Assume a classical tax system.
Which method(s) will give the correct valuation of the new furniture-making project? Select the most correct answer.
Total cash flows can be broken into income and capital cash flows. What is the name given to the income cash flow from owning shares?
The average weekly earnings of an Australian adult worker before tax was $1,542.40 per week in November 2014 according to the Australian Bureau of Statistics. Therefore average annual earnings before tax were $80,204.80 assuming 52 weeks per year. Personal income tax rates published by the Australian Tax Office are reproduced for the 2014-2015 financial year in the table below:
| Taxable income | Tax on this income |
|---|---|
| 0 – $18,200 | Nil |
| $18,201 – $37,000 | 19c for each $1 over $18,200 |
| $37,001 – $80,000 | $3,572 plus 32.5c for each $1 over $37,000 |
| $80,001 – $180,000 | $17,547 plus 37c for each $1 over $80,000 |
| $180,001 and over | $54,547 plus 45c for each $1 over $180,000 |
The above rates do not include the Medicare levy of 2%. Exclude the Medicare levy from your calculations
How much personal income tax would you have to pay per year if you earned $80,204.80 per annum before-tax?
Question 573 bond pricing, zero coupon bond, term structure of interest rates, expectations hypothesis, liquidity premium theory, forward interest rate, yield curve
In the below term structure of interest rates equation, all rates are effective annual yields and the numbers in subscript represent the years that the yields are measured over:
###(1+r_{0-3})^3 = (1+r_{0-1})(1+r_{1-2})(1+r_{2-3}) ###
Which of the following statements is NOT correct?
A trader buys one crude oil European style call option contract on the CME expiring in one year with an exercise price of $44 per barrel for a price of $6.64. The crude oil spot price is $40.33. If the trader doesn’t close out her contract before maturity, then at maturity she will have the:
Which of the below statements about utility is NOT generally accepted by economists? Most people are thought to:
If a variable, say X, is normally distributed with mean ##\mu## and variance ##\sigma^2## then mathematicians write ##X \sim \mathcal{N}(\mu, \sigma^2)##.
If a variable, say Y, is log-normally distributed and the underlying normal distribution has mean ##\mu## and variance ##\sigma^2## then mathematicians write ## Y \sim \mathbf{ln} \mathcal{N}(\mu, \sigma^2)##.
The below three graphs show probability density functions (PDF) of three different random variables Red, Green and Blue.
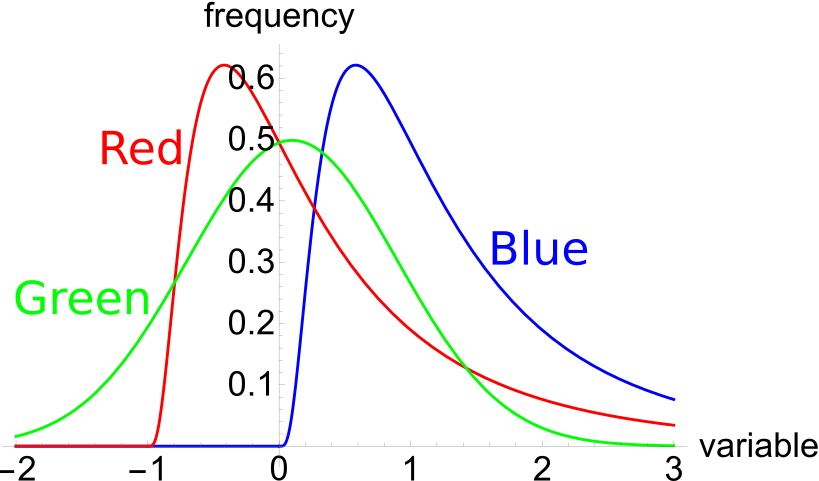
Select the most correct statement: