You just borrowed $400,000 in the form of a 25 year interest-only mortgage with monthly payments of $3,000 per month. The interest rate is 9% pa which is not expected to change.
You actually plan to pay more than the required interest payment. You plan to pay $3,300 in mortgage payments every month, which your mortgage lender allows. These extra payments will reduce the principal and the minimum interest payment required each month.
At the maturity of the mortgage, what will be the principal? That is, after the last (300th) interest payment of $3,300 in 25 years, how much will be owing on the mortgage?
Question 338 market efficiency, CAPM, opportunity cost, technical analysis
A man inherits $500,000 worth of shares.
He believes that by learning the secrets of trading, keeping up with the financial news and doing complex trend analysis with charts that he can quit his job and become a self-employed day trader in the equities markets.
What is the expected gain from doing this over the first year? Measure the net gain in wealth received at the end of this first year due to the decision to become a day trader. Assume the following:
- He earns $60,000 pa in his current job, paid in a lump sum at the end of each year.
- He enjoys examining share price graphs and day trading just as much as he enjoys his current job.
- Stock markets are weak form and semi-strong form efficient.
- He has no inside information.
- He makes 1 trade every day and there are 250 trading days in the year. Trading costs are $20 per trade. His broker invoices him for the trading costs at the end of the year.
- The shares that he currently owns and the shares that he intends to trade have the same level of systematic risk as the market portfolio.
- The market portfolio's expected return is 10% pa.
Measure the net gain over the first year as an expected wealth increase at the end of the year.
A firm plans to issue equity and use the cash raised to pay off its debt. No assets will be bought or sold. Ignore the costs of financial distress.
Which of the following statements is NOT correct, all things remaining equal?
Question 413 CFFA, interest tax shield, depreciation tax shield
There are many ways to calculate a firm's free cash flow (FFCF), also called cash flow from assets (CFFA).
One method is to use the following formulas to transform net income (NI) into FFCF including interest and depreciation tax shields:
###FFCF=NI + Depr - CapEx -ΔNWC + IntExp###
###NI=(Rev - COGS - Depr - FC - IntExp).(1-t_c )###
Another popular method is to use EBITDA rather than net income. EBITDA is defined as:
###EBITDA=Rev - COGS - FC###
One of the below formulas correctly calculates FFCF from EBITDA, including interest and depreciation tax shields, giving an identical answer to that above. Which formula is correct?
The below screenshot of Commonwealth Bank of Australia's (CBA) details were taken from the Google Finance website on 7 Nov 2014. Some information has been deliberately blanked out.
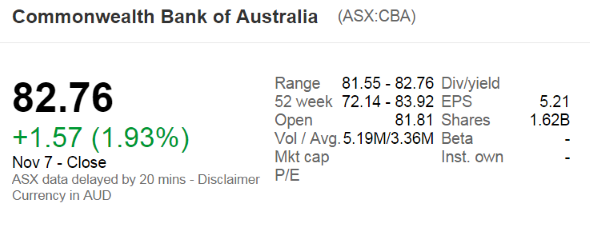
What was CBA's approximate payout ratio over the 2014 financial year?
Note that the firm's interim and final dividends were $1.83 and $2.18 respectively over the 2014 financial year.
Question 543 price gains and returns over time, IRR, NPV, income and capital returns, effective return
For an asset price to triple every 5 years, what must be the expected future capital return, given as an effective annual rate?
A $100 stock has a continuously compounded expected total return of 10% pa. Its dividend yield is 2% pa with continuous compounding. What do you expect its price to be in one year?
Question 768 accounting terminology, book and market values, no explanation
Accountants and finance professionals have lots of names for the same things which can be quite confusing.
Which of the following groups of items are NOT synonyms?
In the home loan market, the acronym LVR stands for Loan to Valuation Ratio. If you bought a house worth one million dollars, partly funded by an $800,000 home loan, then your LVR was 80%. The LVR is equivalent to which of the following ratios?
Question 850 gross domestic product, gross domestic product per capita
Below is a table showing some countries’ GDP, population and GDP per capita.
| Countries' GDP and Population | |||
| GDP | Population | GDP per capita | |
| USD million | millions of people | USD | |
| United States | 18,036,648 | 325 | 55,492 |
| China | 11,158,457 | 1,383 | 8,066 |
| Japan | 4,383,076 | 127 | 34,586 |
| Germany | 3,363,600 | 83 | 40,623 |
| Norway | 500,519 | 5 | 95,027 |
Source: "GDP and its breakdown at current prices in US Dollars" United Nations Statistics Division. December 2016.
Using this data only, which one of these countries’ citizens have the highest living standards?