A manufacturing company is considering a new project in the more risky services industry. The cash flows from assets (CFFA) are estimated for the new project, with interest expense excluded from the calculations. To get the levered value of the project, what should these unlevered cash flows be discounted by?
Assume that the manufacturing firm has a target debt-to-assets ratio that it sticks to.
One method for calculating a firm's free cash flow (FFCF, or CFFA) is to ignore interest expense. That is, pretend that interest expense ##(IntExp)## is zero:
###\begin{aligned} FFCF &= (Rev - COGS - Depr - FC - IntExp)(1-t_c) + Depr - CapEx -\Delta NWC + IntExp \\ &= (Rev - COGS - Depr - FC - 0)(1-t_c) + Depr - CapEx -\Delta NWC - 0\\ \end{aligned}###
Question 386 Merton model of corporate debt, real option, option
A risky firm will last for one period only (t=0 to 1), then it will be liquidated. So it's assets will be sold and the debt holders and equity holders will be paid out in that order. The firm has the following quantities:
##V## = Market value of assets.
##E## = Market value of (levered) equity.
##D## = Market value of zero coupon bonds.
##F_1## = Total face value of zero coupon bonds which is promised to be paid in one year.
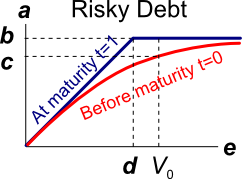
The risky corporate debt graph above contains bold labels a to e. Which of the following statements about those labels is NOT correct?
A share currently worth $100 is expected to pay a constant dividend of $4 for the next 5 years with the first dividend in one year (t=1) and the last in 5 years (t=5).
The total required return is 10% pa.
What do you expected the share price to be in 5 years, just after the dividend at that time has been paid?
Read the following financial statements and calculate the firm's free cash flow over the 2014 financial year.
| UBar Corp | ||
| Income Statement for | ||
| year ending 30th June 2014 | ||
| $m | ||
| Sales | 293 | |
| COGS | 200 | |
| Rent expense | 15 | |
| Gas expense | 8 | |
| Depreciation | 10 | |
| EBIT | 60 | |
| Interest expense | 0 | |
| Taxable income | 60 | |
| Taxes | 18 | |
| Net income | 42 | |
| UBar Corp | ||
| Balance Sheet | ||
| as at 30th June | 2014 | 2013 |
| $m | $m | |
| Assets | ||
| Cash | 30 | 29 |
| Accounts receivable | 5 | 7 |
| Pre-paid rent expense | 1 | 0 |
| Inventory | 50 | 46 |
| PPE | 290 | 300 |
| Total assets | 376 | 382 |
| Liabilities | ||
| Trade payables | 20 | 18 |
| Accrued gas expense | 3 | 2 |
| Non-current liabilities | 0 | 0 |
| Contributed equity | 212 | 212 |
| Retained profits | 136 | 150 |
| Asset revaluation reserve | 5 | 0 |
| Total L and OE | 376 | 382 |
Note: all figures are given in millions of dollars ($m).
The firm's free cash flow over the 2014 financial year was:
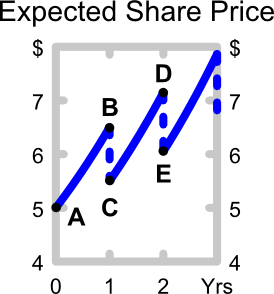
The perpetuity with growth formula, also known as the dividend discount model (DDM) or Gordon growth model, is appropriate for valuing a company's shares. ##P_0## is the current share price, ##C_1## is next year's expected dividend, ##r## is the total required return and ##g## is the expected growth rate of the dividend.
###P_0=\dfrac{C_1}{r-g}###
The below graph shows the expected future price path of the company's shares. Which of the following statements about the graph is NOT correct?
A 2-year futures contract on a stock paying a continuous dividend yield of 3% pa was bought when the underlying stock price was $10 and the risk free rate was 10% per annum with continuous compounding. Assume that investors are risk-neutral, so the stock's total required return is the risk free rate.
Find the forward price ##(F_2)## and value of the contract ##(V_0)## initially. Also find the value of the contract in 6 months ##(V_{0.5})## if the stock price rose to $12.
Which of the below formulas gives the payoff at maturity ##(f_T)## from being long a future? Let the underlying asset price at maturity be ##S_T## and the locked-in futures price be ##K_T##.
Question 723 mean and median returns, return distribution, arithmetic and geometric averages, continuously compounding rate
Here is a table of stock prices and returns. Which of the statements below the table is NOT correct?
| Price and Return Population Statistics | ||||
| Time | Prices | LGDR | GDR | NDR |
| 0 | 100 | |||
| 1 | 99 | -0.010050 | 0.990000 | -0.010000 |
| 2 | 180.40 | 0.600057 | 1.822222 | 0.822222 |
| 3 | 112.73 | 0.470181 | 0.624889 | 0.375111 |
| Arithmetic average | 0.0399 | 1.1457 | 0.1457 | |
| Arithmetic standard deviation | 0.4384 | 0.5011 | 0.5011 | |