Question 69 interest tax shield, capital structure, leverage, WACC
Which statement about risk, required return and capital structure is the most correct?
| Portfolio Details | ||||||
| Stock | Expected return |
Standard deviation |
Covariance ##(\sigma_{A,B})## | Beta | Dollars invested |
|
| A | 0.2 | 0.4 | 0.12 | 0.5 | 40 | |
| B | 0.3 | 0.8 | 1.5 | 80 | ||
What is the standard deviation (not variance) of the above portfolio? Note that the stocks' covariance is given, not correlation.
A stock was bought for $8 and paid a dividend of $0.50 one year later (at t=1 year). Just after the dividend was paid, the stock price was $7 (at t=1 year).
What were the total, capital and dividend returns given as effective annual rates? The choices are given in the same order:
##r_\text{total}##, ##r_\text{capital}##, ##r_\text{dividend}##.
Find Sidebar Corporation's Cash Flow From Assets (CFFA), also known as Free Cash Flow to the Firm (FCFF), over the year ending 30th June 2013.
| Sidebar Corp | ||
| Income Statement for | ||
| year ending 30th June 2013 | ||
| $m | ||
| Sales | 405 | |
| COGS | 100 | |
| Depreciation | 34 | |
| Rent expense | 22 | |
| Interest expense | 39 | |
| Taxable Income | 210 | |
| Taxes at 30% | 63 | |
| Net income | 147 | |
| Sidebar Corp | ||
| Balance Sheet | ||
| as at 30th June | 2013 | 2012 |
| $m | $m | |
| Cash | 0 | 0 |
| Inventory | 70 | 50 |
| Trade debtors | 11 | 16 |
| Rent paid in advance | 4 | 3 |
| PPE | 700 | 680 |
| Total assets | 785 | 749 |
| Trade creditors | 11 | 19 |
| Bond liabilities | 400 | 390 |
| Contributed equity | 220 | 220 |
| Retained profits | 154 | 120 |
| Total L and OE | 785 | 749 |
Note: All figures are given in millions of dollars ($m).
The cash flow from assets was:
Which one of the following will have no effect on net income (NI) but decrease cash flow from assets (CFFA or FFCF) in this year for a tax-paying firm, all else remaining constant?
Remember:
###NI=(Rev-COGS-FC-Depr-IntExp).(1-t_c )### ###CFFA=NI+Depr-CapEx - ΔNWC+IntExp###Question 446 working capital decision, corporate financial decision theory
The working capital decision primarily affects which part of a business?
Question 448 franking credit, personal tax on dividends, imputation tax system
A small private company has a single shareholder. This year the firm earned a $100 profit before tax. All of the firm's after tax profits will be paid out as dividends to the owner.
The corporate tax rate is 30% and the sole shareholder's personal marginal tax rate is 45%.
The Australian imputation tax system applies because the company generates all of its income in Australia and pays corporate tax to the Australian Tax Office. Therefore all of the company's dividends are fully franked. The sole shareholder is an Australian for tax purposes and can therefore use the franking credits to offset his personal income tax liability.
What will be the personal tax payable by the shareholder and the corporate tax payable by the company?
Question 522 income and capital returns, real and nominal returns and cash flows, inflation, real estate
A residential investment property has an expected nominal total return of 6% pa and nominal capital return of 2.5% pa. Inflation is expected to be 2.5% pa.
All of the above are effective nominal rates and investors believe that they will stay the same in perpetuity.
What are the property's expected real total, capital and income returns?
The answer choices below are given in the same order.
You have $100,000 in the bank. The bank pays interest at 10% pa, given as an effective annual rate.
You wish to consume half as much now (t=0) as in one year (t=1) and have nothing left in the bank at the end.
How much can you consume at time zero and one? The answer choices are given in the same order.
If a variable, say X, is normally distributed with mean ##\mu## and variance ##\sigma^2## then mathematicians write ##X \sim \mathcal{N}(\mu, \sigma^2)##.
If a variable, say Y, is log-normally distributed and the underlying normal distribution has mean ##\mu## and variance ##\sigma^2## then mathematicians write ## Y \sim \mathbf{ln} \mathcal{N}(\mu, \sigma^2)##.
The below three graphs show probability density functions (PDF) of three different random variables Red, Green and Blue.
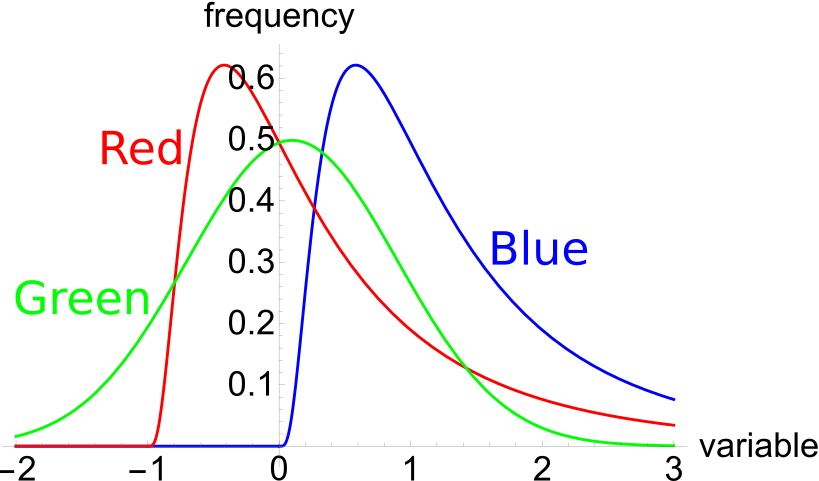
Select the most correct statement: