Question 69 interest tax shield, capital structure, leverage, WACC
Which statement about risk, required return and capital structure is the most correct?
| Portfolio Details | ||||||
| Stock | Expected return |
Standard deviation |
Correlation ##(\rho_{A,B})## | Dollars invested |
||
| A | 0.1 | 0.4 | 0.5 | 60 | ||
| B | 0.2 | 0.6 | 140 | |||
What is the standard deviation (not variance) of returns of the above portfolio?
A large proportion of a levered firm's assets is cash held at the bank. The firm is financed with half equity and half debt.
Which of the following statements about this firm's enterprise value (EV) and total asset value (V) is NOT correct?
The perpetuity with growth equation is:
###P_0=\dfrac{C_1}{r-g}###
Which of the following is NOT equal to the expected capital return as an effective annual rate?
Let the 'income return' of a bond be the coupon at the end of the period divided by the market price now at the start of the period ##(C_1/P_0)##. The expected income return of a premium fixed coupon bond is:
Question 740 real and nominal returns and cash flows, DDM, inflation
Taking inflation into account when using the DDM can be hard. Which of the following formulas will NOT give a company's current stock price ##(P_0)##? Assume that the annual dividend was just paid ##(C_0)##, and the next dividend will be paid in one year ##(C_1)##.
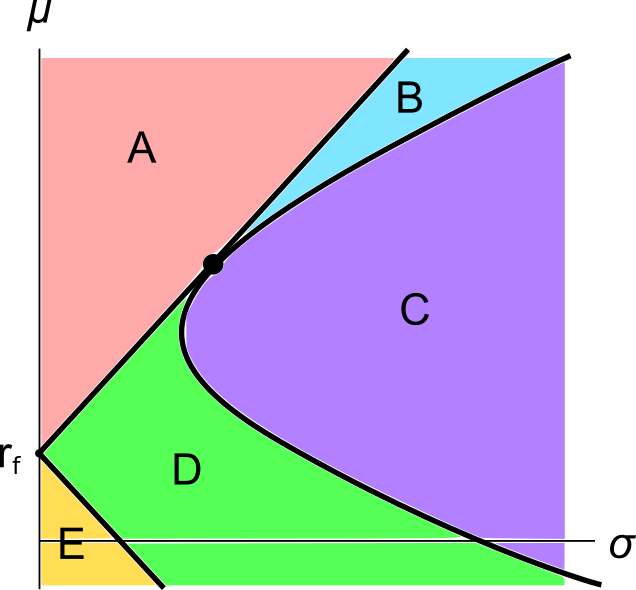
A graph of assets’ expected returns ##(\mu)## versus standard deviations ##(\sigma)## is given in the below diagram.
Each letter corresponds to a separate coloured area. The portfolios at the boundary of the areas, on the black lines, are excluded from each area. Assume that all assets represented in this graph are fairly priced, and that all risky assets can be short-sold.
Which of the following statements about this graph and Markowitz portfolio theory is NOT correct?
Calculate Australia’s GDP over the 2016 calendar year using the below table:
| Australian Gross Domestic Product Components | ||||
| A$ billion, 2016 Calendar Year from 1 Jan 2016 to 31 Dec 2016 inclusive | ||||
| Consumption | Investment | Government spending | Exports | Imports |
| 971 | 421 | 320 | 328 | 344 |
Source: ABS 5206.0 Australian National Accounts: National Income, Expenditure and Product. Table 3. Expenditure on Gross Domestic Product (GDP), Current prices.
Over the 2016 calendar year, Australia’s GDP was:
Question 880 gold standard, no explanation
Under the Gold Standard (1876 to 1913), currencies were priced relative to: