Question 707 continuously compounding rate, continuously compounding rate conversion
Convert a 10% effective annual rate ##(r_\text{eff annual})## into a continuously compounded annual rate ##(r_\text{cc annual})##. The equivalent continuously compounded annual rate is:
Question 711 continuously compounding rate, continuously compounding rate conversion
A continuously compounded semi-annual return of 5% ##(r_\text{cc 6mth})## is equivalent to a continuously compounded annual return ##(r_\text{cc annual})## of:
An effective semi-annual return of 5% ##(r_\text{eff 6mth})## is equivalent to an effective annual return ##(r_\text{eff annual})## of:
Question 691 continuously compounding rate, effective rate, continuously compounding rate conversion, no explanation
A bank quotes an interest rate of 6% pa with quarterly compounding. Note that another way of stating this rate is that it is an annual percentage rate (APR) compounding discretely every 3 months.
Which of the following statements about this rate is NOT correct? All percentages are given to 6 decimal places. The equivalent:
If a variable, say X, is normally distributed with mean ##\mu## and variance ##\sigma^2## then mathematicians write ##X \sim \mathcal{N}(\mu, \sigma^2)##.
If a variable, say Y, is log-normally distributed and the underlying normal distribution has mean ##\mu## and variance ##\sigma^2## then mathematicians write ## Y \sim \mathbf{ln} \mathcal{N}(\mu, \sigma^2)##.
The below three graphs show probability density functions (PDF) of three different random variables Red, Green and Blue.
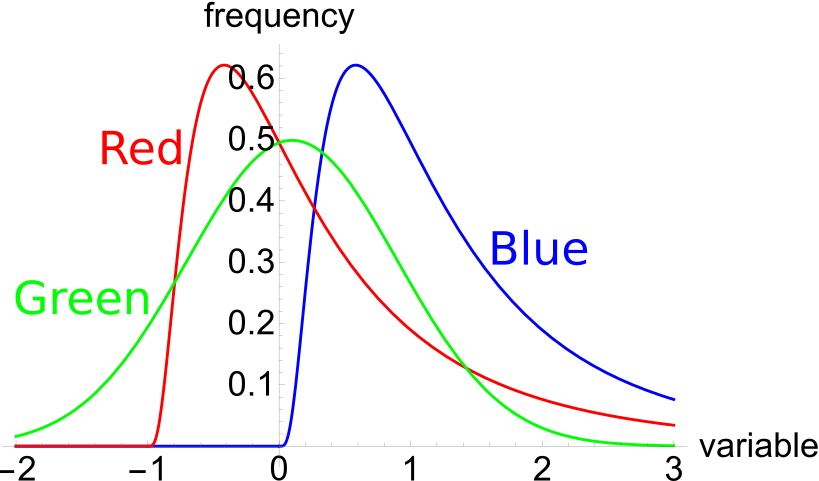
Select the most correct statement:
The below three graphs show probability density functions (PDF) of three different random variables Red, Green and Blue. Let ##P_1## be the unknown price of a stock in one year. ##P_1## is a random variable. Let ##P_0 = 1##, so the share price now is $1. This one dollar is a constant, it is not a variable.
Which of the below statements is NOT correct? Financial practitioners commonly assume that the shape of the PDF represented in the colour:
Question 719 mean and median returns, return distribution, arithmetic and geometric averages, continuously compounding rate
A stock has an arithmetic average continuously compounded return (AALGDR) of 10% pa, a standard deviation of continuously compounded returns (SDLGDR) of 80% pa and current stock price of $1. Assume that stock prices are log-normally distributed. The graph below summarises this information and provides some helpful formulas.
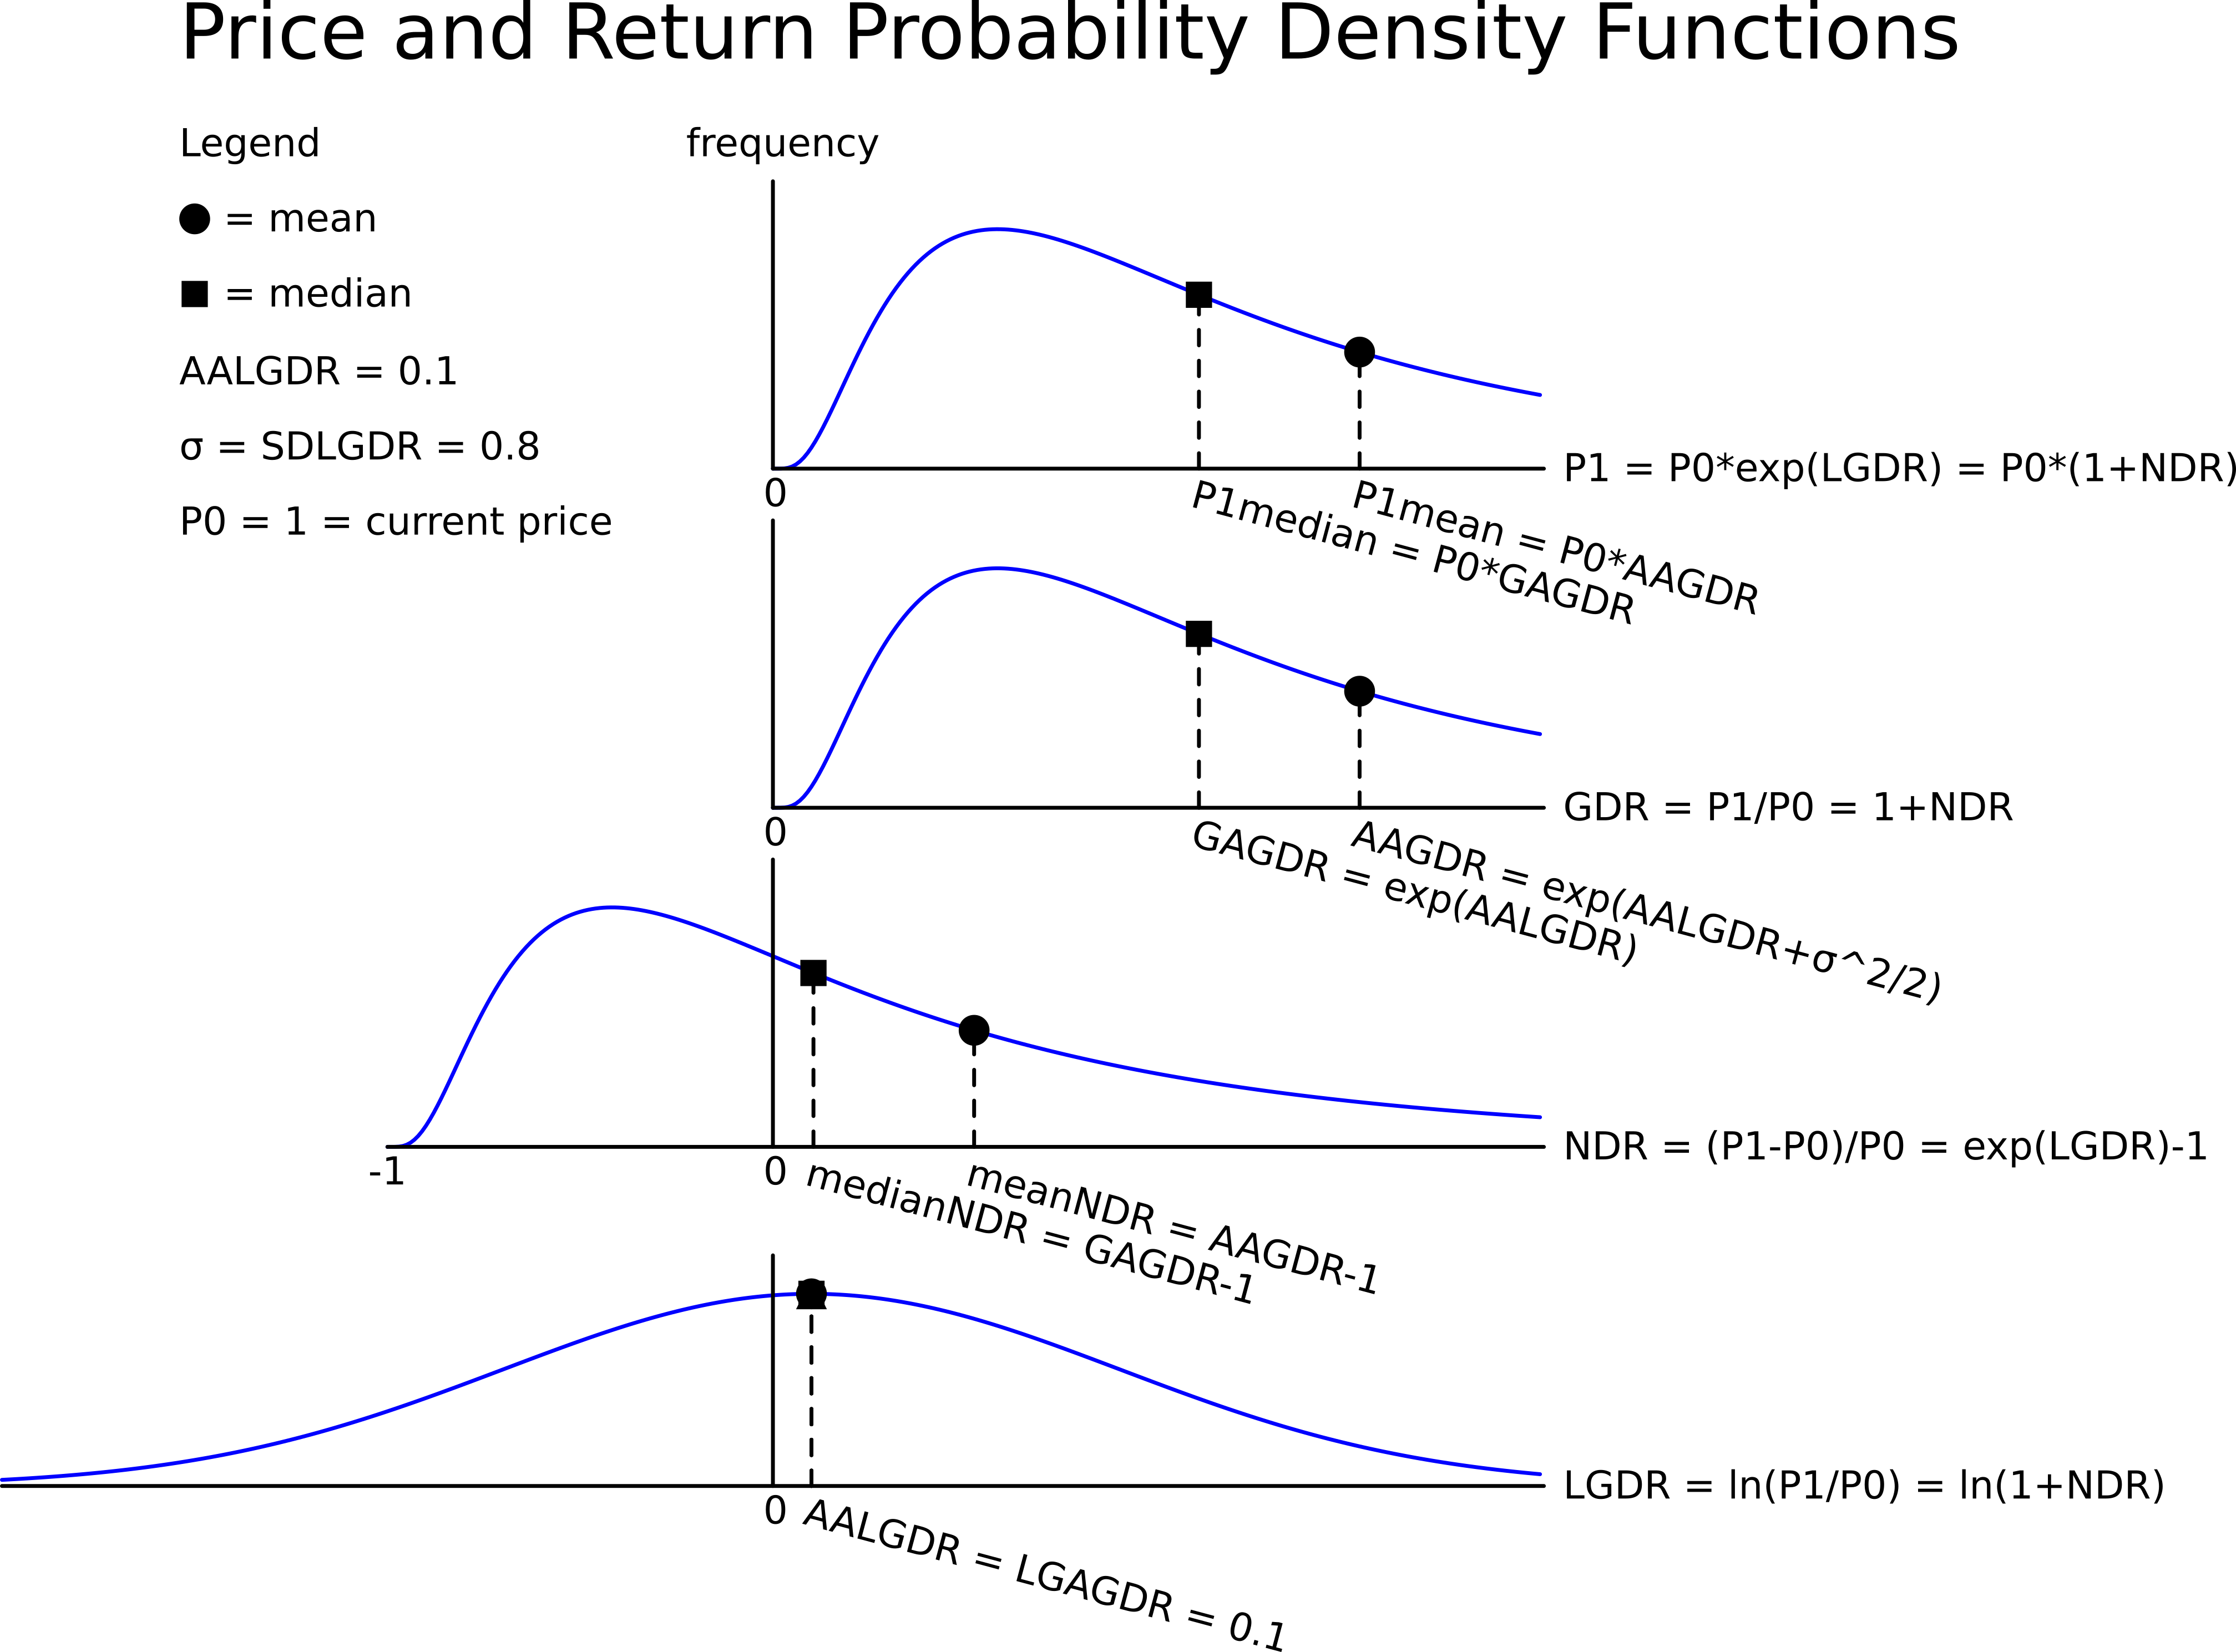
In one year, what do you expect the median and mean prices to be? The answer options are given in the same order.
Question 720 mean and median returns, return distribution, arithmetic and geometric averages, continuously compounding rate
A stock has an arithmetic average continuously compounded return (AALGDR) of 10% pa, a standard deviation of continuously compounded returns (SDLGDR) of 80% pa and current stock price of $1. Assume that stock prices are log-normally distributed.
In 5 years, what do you expect the median and mean prices to be? The answer options are given in the same order.
Question 723 mean and median returns, return distribution, arithmetic and geometric averages, continuously compounding rate
Here is a table of stock prices and returns. Which of the statements below the table is NOT correct?
| Price and Return Population Statistics | ||||
| Time | Prices | LGDR | GDR | NDR |
| 0 | 100 | |||
| 1 | 99 | -0.010050 | 0.990000 | -0.010000 |
| 2 | 180.40 | 0.600057 | 1.822222 | 0.822222 |
| 3 | 112.73 | 0.470181 | 0.624889 | 0.375111 |
| Arithmetic average | 0.0399 | 1.1457 | 0.1457 | |
| Arithmetic standard deviation | 0.4384 | 0.5011 | 0.5011 | |
Question 779 mean and median returns, return distribution, arithmetic and geometric averages, continuously compounding rate
Fred owns some BHP shares. He has calculated BHP’s monthly returns for each month in the past 30 years using this formula:
###r_\text{t monthly}=\ln \left( \dfrac{P_t}{P_{t-1}} \right)###He then took the arithmetic average and found it to be 0.8% per month using this formula:
###\bar{r}_\text{monthly}= \dfrac{ \displaystyle\sum\limits_{t=1}^T{\left( r_\text{t monthly} \right)} }{T} =0.008=0.8\% \text{ per month}###He also found the standard deviation of these monthly returns which was 15% per month:
###\sigma_\text{monthly} = \dfrac{ \displaystyle\sum\limits_{t=1}^T{\left( \left( r_\text{t monthly} - \bar{r}_\text{monthly} \right)^2 \right)} }{T} =0.15=15\%\text{ per month}###Assume that the past historical average return is the true population average of future expected returns and the stock's returns calculated above ##(r_\text{t monthly})## are normally distributed. Which of the below statements about Fred’s BHP shares is NOT correct?