Question 719 mean and median returns, return distribution, arithmetic and geometric averages, continuously compounding rate
A stock has an arithmetic average continuously compounded return (AALGDR) of 10% pa, a standard deviation of continuously compounded returns (SDLGDR) of 80% pa and current stock price of $1. Assume that stock prices are log-normally distributed. The graph below summarises this information and provides some helpful formulas.
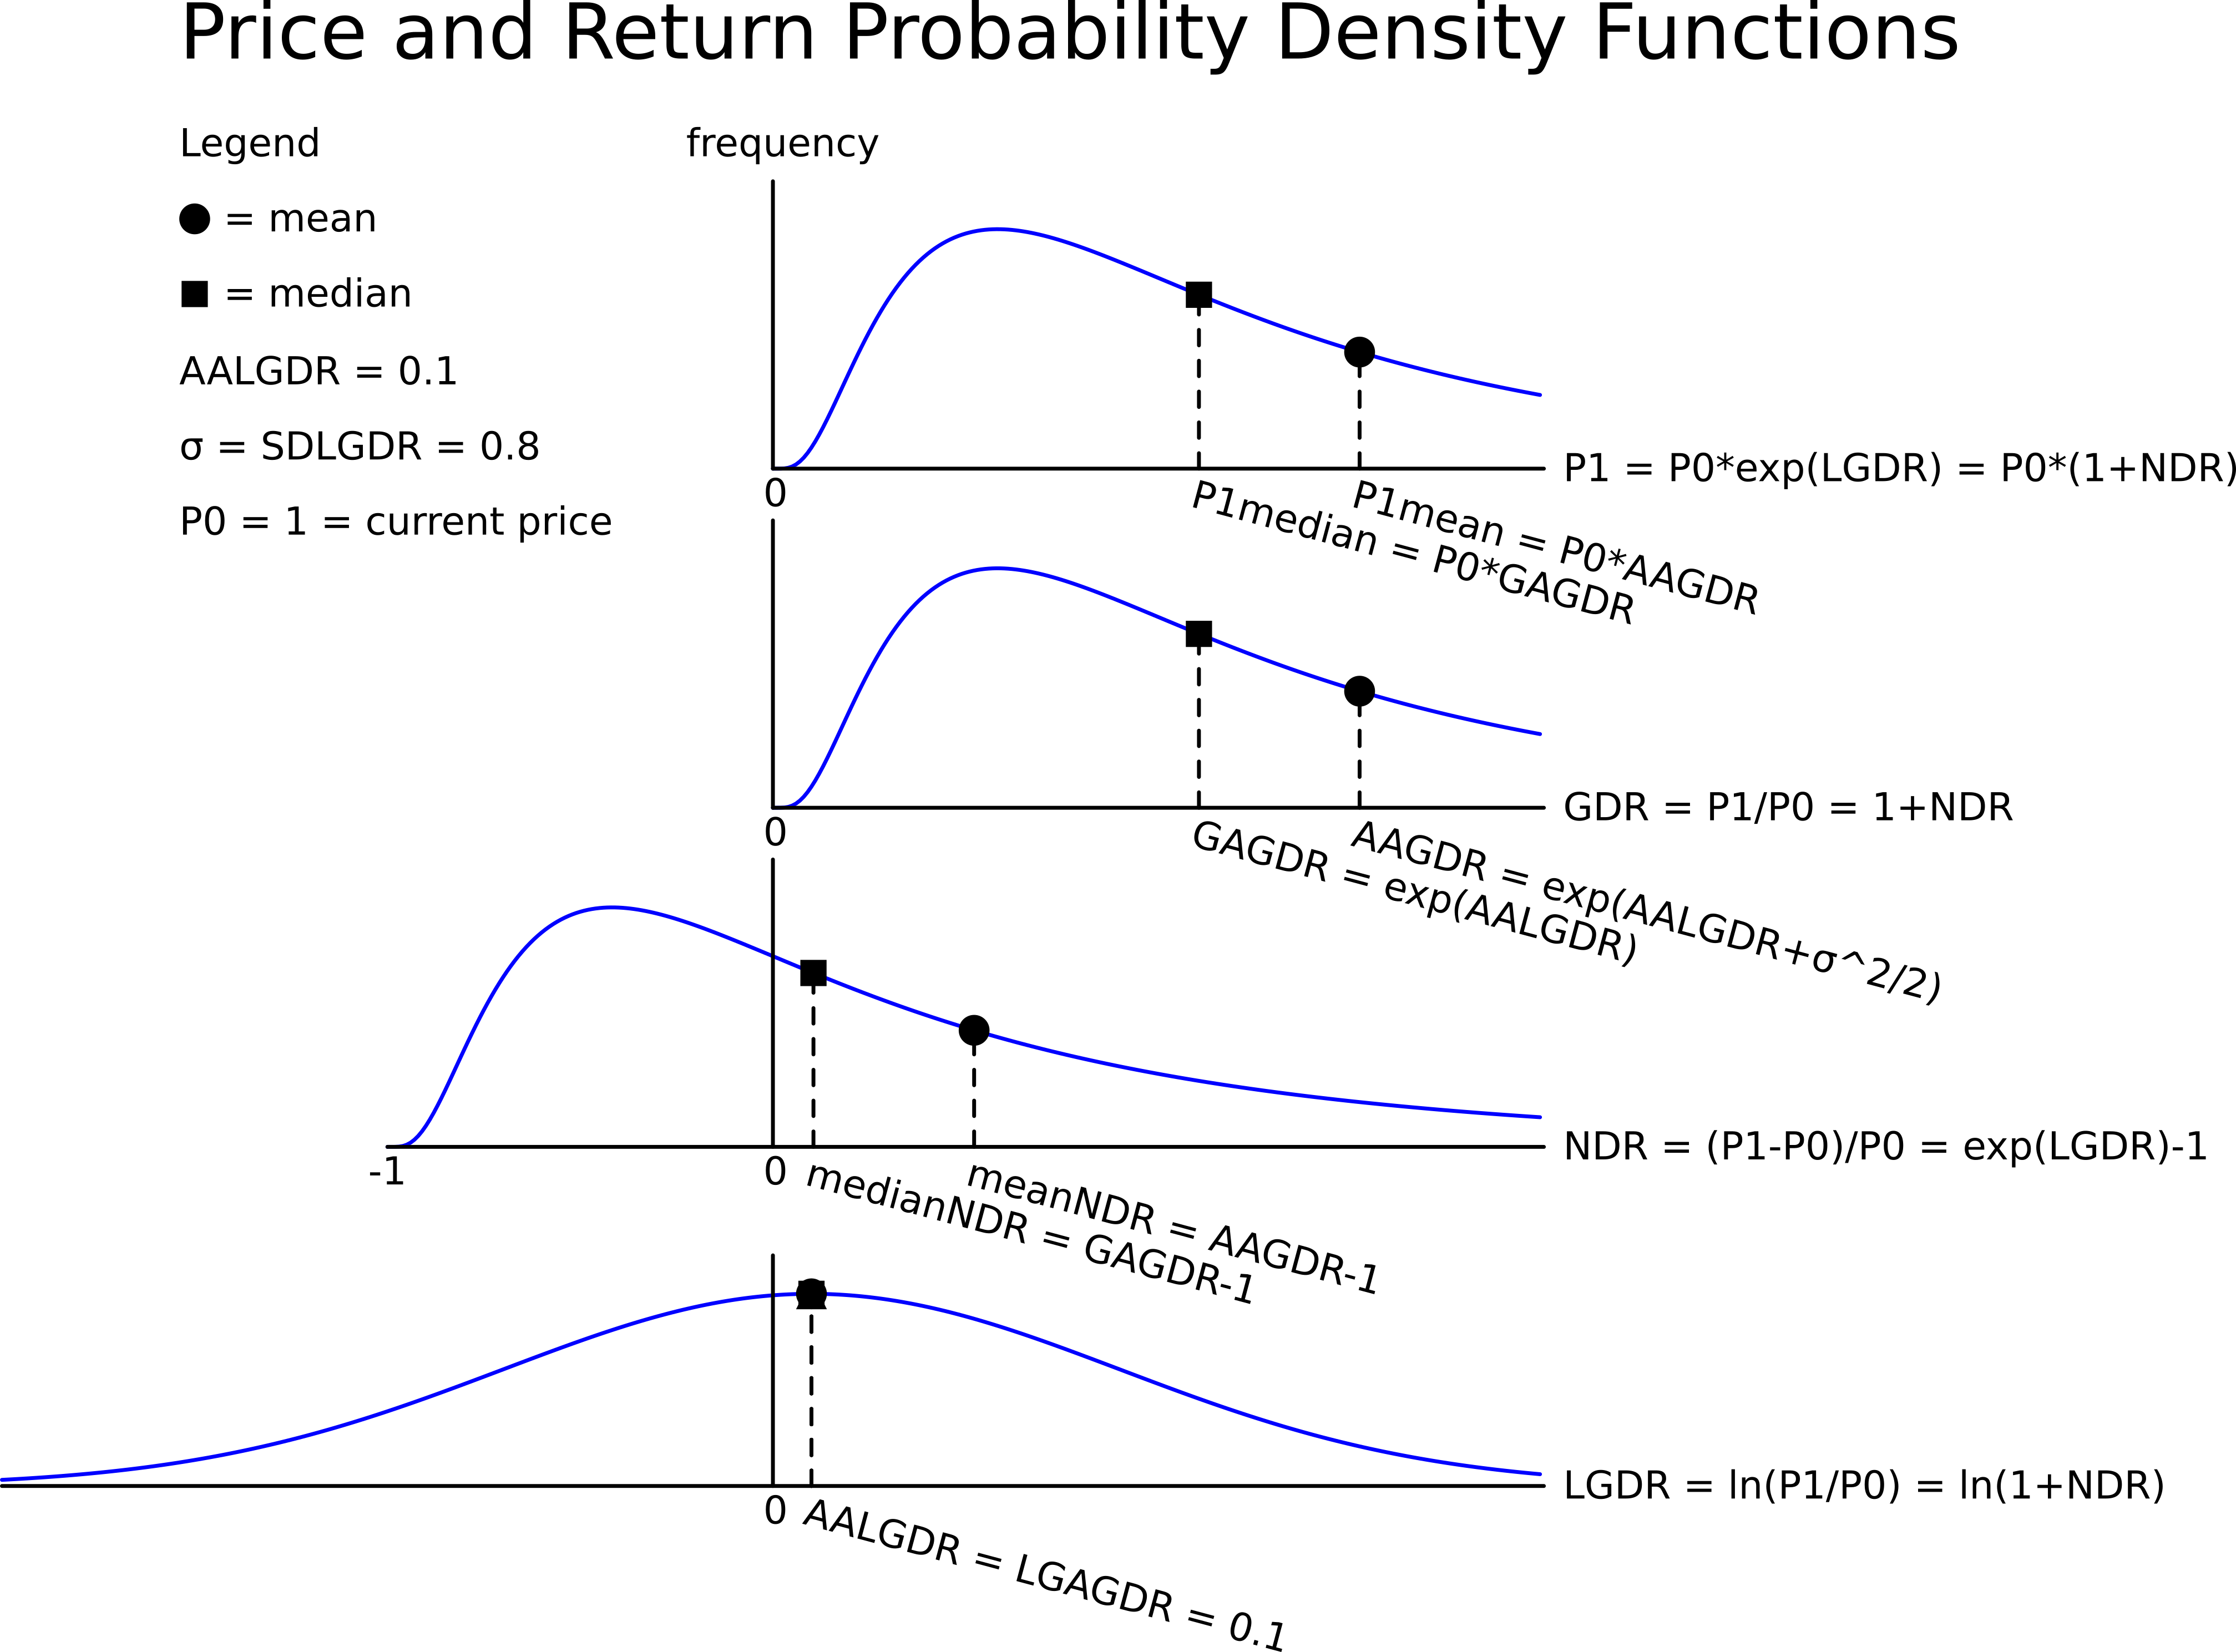
In one year, what do you expect the median and mean prices to be? The answer options are given in the same order.
Question 720 mean and median returns, return distribution, arithmetic and geometric averages, continuously compounding rate
A stock has an arithmetic average continuously compounded return (AALGDR) of 10% pa, a standard deviation of continuously compounded returns (SDLGDR) of 80% pa and current stock price of $1. Assume that stock prices are log-normally distributed.
In 5 years, what do you expect the median and mean prices to be? The answer options are given in the same order.
Question 721 mean and median returns, return distribution, arithmetic and geometric averages, continuously compounding rate
Fred owns some Commonwealth Bank (CBA) shares. He has calculated CBA’s monthly returns for each month in the past 20 years using this formula:
###r_\text{t monthly}=\ln \left( \dfrac{P_t}{P_{t-1}} \right)###He then took the arithmetic average and found it to be 1% per month using this formula:
###\bar{r}_\text{monthly}= \dfrac{ \displaystyle\sum\limits_{t=1}^T{\left( r_\text{t monthly} \right)} }{T} =0.01=1\% \text{ per month}###He also found the standard deviation of these monthly returns which was 5% per month:
###\sigma_\text{monthly} = \dfrac{ \displaystyle\sum\limits_{t=1}^T{\left( \left( r_\text{t monthly} - \bar{r}_\text{monthly} \right)^2 \right)} }{T} =0.05=5\%\text{ per month}###Which of the below statements about Fred’s CBA shares is NOT correct? Assume that the past historical average return is the true population average of future expected returns.
Question 722 mean and median returns, return distribution, arithmetic and geometric averages, continuously compounding rate
Here is a table of stock prices and returns. Which of the statements below the table is NOT correct?
| Price and Return Population Statistics | ||||
| Time | Prices | LGDR | GDR | NDR |
| 0 | 100 | |||
| 1 | 50 | -0.6931 | 0.5 | -0.5 |
| 2 | 100 | 0.6931 | 2 | 1 |
| Arithmetic average | 0 | 1.25 | 0.25 | |
| Arithmetic standard deviation | 0.9802 | 1.0607 | 1.0607 | |
Question 723 mean and median returns, return distribution, arithmetic and geometric averages, continuously compounding rate
Here is a table of stock prices and returns. Which of the statements below the table is NOT correct?
| Price and Return Population Statistics | ||||
| Time | Prices | LGDR | GDR | NDR |
| 0 | 100 | |||
| 1 | 99 | -0.010050 | 0.990000 | -0.010000 |
| 2 | 180.40 | 0.600057 | 1.822222 | 0.822222 |
| 3 | 112.73 | 0.470181 | 0.624889 | 0.375111 |
| Arithmetic average | 0.0399 | 1.1457 | 0.1457 | |
| Arithmetic standard deviation | 0.4384 | 0.5011 | 0.5011 | |
Question 779 mean and median returns, return distribution, arithmetic and geometric averages, continuously compounding rate
Fred owns some BHP shares. He has calculated BHP’s monthly returns for each month in the past 30 years using this formula:
###r_\text{t monthly}=\ln \left( \dfrac{P_t}{P_{t-1}} \right)###He then took the arithmetic average and found it to be 0.8% per month using this formula:
###\bar{r}_\text{monthly}= \dfrac{ \displaystyle\sum\limits_{t=1}^T{\left( r_\text{t monthly} \right)} }{T} =0.008=0.8\% \text{ per month}###He also found the standard deviation of these monthly returns which was 15% per month:
###\sigma_\text{monthly} = \dfrac{ \displaystyle\sum\limits_{t=1}^T{\left( \left( r_\text{t monthly} - \bar{r}_\text{monthly} \right)^2 \right)} }{T} =0.15=15\%\text{ per month}###Assume that the past historical average return is the true population average of future expected returns and the stock's returns calculated above ##(r_\text{t monthly})## are normally distributed. Which of the below statements about Fred’s BHP shares is NOT correct?
Question 790 mean and median returns, return distribution, arithmetic and geometric averages, continuously compounding rate, log-normal distribution, VaR, confidence interval
A risk manager has identified that their hedge fund’s continuously compounded portfolio returns are normally distributed with a mean of 10% pa and a standard deviation of 30% pa. The hedge fund’s portfolio is currently valued at $100 million. Assume that there is no estimation error in these figures and that the normal cumulative density function at 1.644853627 is 95%.
Which of the following statements is NOT correct? All answers are rounded to the nearest dollar.
Question 791 mean and median returns, return distribution, arithmetic and geometric averages, continuously compounding rate, log-normal distribution, VaR, confidence interval
A risk manager has identified that their pension fund’s continuously compounded portfolio returns are normally distributed with a mean of 5% pa and a standard deviation of 20% pa. The fund’s portfolio is currently valued at $1 million. Assume that there is no estimation error in the above figures. To simplify your calculations, all answers below use 2.33 as an approximation for the normal inverse cumulative density function at 99%. All answers are rounded to the nearest dollar. Which of the following statements is NOT correct?
Question 792 mean and median returns, return distribution, arithmetic and geometric averages, continuously compounding rate, log-normal distribution, confidence interval
A risk manager has identified that their investment fund’s continuously compounded portfolio returns are normally distributed with a mean of 10% pa and a standard deviation of 40% pa. The fund’s portfolio is currently valued at $1 million. Assume that there is no estimation error in the above figures. To simplify your calculations, all answers below use 2.33 as an approximation for the normal inverse cumulative density function at 99%. All answers are rounded to the nearest dollar. Assume one month is 1/12 of a year. Which of the following statements is NOT correct?
Question 811 log-normal distribution, mean and median returns, return distribution, arithmetic and geometric averages
Which of the following statements about probability distributions is NOT correct?
Question 925 mean and median returns, return distribution, arithmetic and geometric averages, continuously compounding rate, no explanation
The arithmetic average and standard deviation of returns on the ASX200 accumulation index over the 24 years from 31 Dec 1992 to 31 Dec 2016 were calculated as follows:
###\bar{r}_\text{yearly} = \dfrac{ \displaystyle\sum\limits_{t=1992}^{24}{\left( \ln \left( \dfrac{P_{t+1}}{P_t} \right) \right)} }{T} = \text{AALGDR} =0.0949=9.49\% \text{ pa}###
###\sigma_\text{yearly} = \dfrac{ \displaystyle\sum\limits_{t=1992}^{24}{\left( \left( \ln \left( \dfrac{P_{t+1}}{P_t} \right) - \bar{r}_\text{yearly} \right)^2 \right)} }{T} = \text{SDLGDR} = 0.1692=16.92\text{ pp pa}###
Assume that the log gross discrete returns are normally distributed and that the above estimates are true population statistics, not sample statistics, so there is no standard error in the sample mean or standard deviation estimates. Also assume that the standardised normal Z-statistic corresponding to a one-tail probability of 2.5% is exactly -1.96.
Which of the following statements is NOT correct? If you invested $1m today in the ASX200, then over the next 4 years:
Question 926 mean and median returns, return distribution, arithmetic and geometric averages, continuously compounding rate
The arithmetic average continuously compounded or log gross discrete return (AALGDR) on the ASX200 accumulation index over the 24 years from 31 Dec 1992 to 31 Dec 2016 is 9.49% pa.
The arithmetic standard deviation (SDLGDR) is 16.92 percentage points pa.
Assume that the log gross discrete returns are normally distributed and that the above estimates are true population statistics, not sample statistics, so there is no standard error in the sample mean or standard deviation estimates. Also assume that the standardised normal Z-statistic corresponding to a one-tail probability of 2.5% is exactly -1.96.
If you had a $1 million fund that replicated the ASX200 accumulation index, in how many years would the median dollar value of your fund first be expected to lie outside the 95% confidence interval forecast?
Question 927 mean and median returns, mode return, return distribution, arithmetic and geometric averages, continuously compounding rate
The arithmetic average continuously compounded or log gross discrete return (AALGDR) on the ASX200 accumulation index over the 24 years from 31 Dec 1992 to 31 Dec 2016 is 9.49% pa.
The arithmetic standard deviation (SDLGDR) is 16.92 percentage points pa.
Assume that the log gross discrete returns are normally distributed and that the above estimates are true population statistics, not sample statistics, so there is no standard error in the sample mean or standard deviation estimates. Also assume that the standardised normal Z-statistic corresponding to a one-tail probability of 2.5% is exactly -1.96.
If you had a $1 million fund that replicated the ASX200 accumulation index, in how many years would the mean dollar value of your fund first be expected to lie outside the 95% confidence interval forecast?
Question 928 mean and median returns, mode return, return distribution, arithmetic and geometric averages, continuously compounding rate, no explanation
The arithmetic average continuously compounded or log gross discrete return (AALGDR) on the ASX200 accumulation index over the 24 years from 31 Dec 1992 to 31 Dec 2016 is 9.49% pa.
The arithmetic standard deviation (SDLGDR) is 16.92 percentage points pa.
Assume that the log gross discrete returns are normally distributed and that the above estimates are true population statistics, not sample statistics, so there is no standard error in the sample mean or standard deviation estimates. Also assume that the standardised normal Z-statistic corresponding to a one-tail probability of 2.5% is exactly -1.96.
If you had a $1 million fund that replicated the ASX200 accumulation index, in how many years would the mode dollar value of your fund first be expected to lie outside the 95% confidence interval forecast?
Note that the mode of a log-normally distributed future price is: ##P_{T \text{ mode}} = P_0.e^{(\text{AALGDR} - \text{SDLGDR}^2 ).T} ##
Question 929 standard error, mean and median returns, mode return, return distribution, arithmetic and geometric averages, continuously compounding rate
The arithmetic average continuously compounded or log gross discrete return (AALGDR) on the ASX200 accumulation index over the 24 years from 31 Dec 1992 to 31 Dec 2016 is 9.49% pa.
The arithmetic standard deviation (SDLGDR) is 16.92 percentage points pa.
Assume that the data are sample statistics, not population statistics. Assume that the log gross discrete returns are normally distributed.
What is the standard error of your estimate of the sample ASX200 accumulation index arithmetic average log gross discrete return (AALGDR) over the 24 years from 1992 to 2016?