| Portfolio Details | ||||||
| Stock | Expected return |
Standard deviation |
Correlation | Beta | Dollars invested |
|
| A | 0.2 | 0.4 | 0.12 | 0.5 | 40 | |
| B | 0.3 | 0.8 | 1.5 | 80 | ||
What is the beta of the above portfolio?
A company runs a number of slaughterhouses which supply hamburger meat to McDonalds. The company is afraid that live cattle prices will increase over the next year, even though there is widespread belief in the market that they will be stable. What can the company do to hedge against the risk of increasing live cattle prices? Which statement(s) are correct?
(i) buy call options on live cattle.
(ii) buy put options on live cattle.
(iii) sell call options on live cattle.
Select the most correct response:
Question 104 CAPM, payout policy, capital structure, Miller and Modigliani, risk
Assume that there exists a perfect world with no transaction costs, no asymmetric information, no taxes, no agency costs, equal borrowing rates for corporations and individual investors, the ability to short the risk free asset, semi-strong form efficient markets, the CAPM holds, investors are rational and risk-averse and there are no other market frictions.
For a firm operating in this perfect world, which statement(s) are correct?
(i) When a firm changes its capital structure and/or payout policy, share holders' wealth is unaffected.
(ii) When the idiosyncratic risk of a firm's assets increases, share holders do not expect higher returns.
(iii) When the systematic risk of a firm's assets increases, share holders do not expect higher returns.
Select the most correct response:
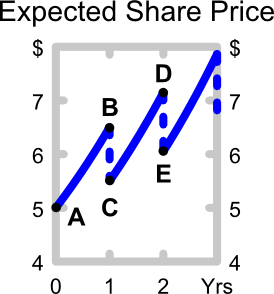
The perpetuity with growth formula, also known as the dividend discount model (DDM) or Gordon growth model, is appropriate for valuing a company's shares. ##P_0## is the current share price, ##C_1## is next year's expected dividend, ##r## is the total required return and ##g## is the expected growth rate of the dividend.
###P_0=\dfrac{C_1}{r-g}###
The below graph shows the expected future price path of the company's shares. Which of the following statements about the graph is NOT correct?
Which of the following statements about futures contracts on shares is NOT correct, assuming that markets are efficient?
When an equity future is first negotiated (at t=0):
A stock has a beta of 1.5. The market's expected total return is 10% pa and the risk free rate is 5% pa, both given as effective annual rates.
Over the last year, bad economic news was released showing a higher chance of recession. Over this time the share market fell by 1%. So ##r_{m} = (P_{0} - P_{-1})/P_{-1} = -0.01##, where the current time is zero and one year ago is time -1. The risk free rate was unchanged.
What do you think was the stock's historical return over the last year, given as an effective annual rate?
By convention, money market securities' yields are always quoted as:
The market's expected total return is 10% pa and the risk free rate is 5% pa, both given as effective annual rates.
A stock has a beta of 0.7.
What do you think will be the stock's expected return over the next year, given as an effective annual rate?