| Portfolio Details | ||||||
| Stock | Expected return |
Standard deviation |
Covariance ##(\sigma_{A,B})## | Beta | Dollars invested |
|
| A | 0.2 | 0.4 | 0.12 | 0.5 | 40 | |
| B | 0.3 | 0.8 | 1.5 | 80 | ||
What is the standard deviation (not variance) of the above portfolio? Note that the stocks' covariance is given, not correlation.
You want to buy an apartment worth $500,000. You have saved a deposit of $50,000. The bank has agreed to lend you the $450,000 as a fully amortising mortgage loan with a term of 25 years. The interest rate is 6% pa and is not expected to change.
What will be your monthly payments?
A project's Profitability Index (PI) is less than 1. Select the most correct statement:
You want to buy a house priced at $400,000. You have saved a deposit of $40,000. The bank has agreed to lend you $360,000 as a fully amortising loan with a term of 30 years. The interest rate is 8% pa payable monthly and is not expected to change.
What will be your monthly payments?
Question 323 foreign exchange rate, monetary policy, American and European terms
The market expects the Reserve Bank of Australia (RBA) to increase the policy rate by 25 basis points at their next meeting.
As expected, the RBA increases the policy rate by 25 basis points.
What do you expect to happen to Australia's exchange rate in the short term? The Australian dollar will:
Question 338 market efficiency, CAPM, opportunity cost, technical analysis
A man inherits $500,000 worth of shares.
He believes that by learning the secrets of trading, keeping up with the financial news and doing complex trend analysis with charts that he can quit his job and become a self-employed day trader in the equities markets.
What is the expected gain from doing this over the first year? Measure the net gain in wealth received at the end of this first year due to the decision to become a day trader. Assume the following:
- He earns $60,000 pa in his current job, paid in a lump sum at the end of each year.
- He enjoys examining share price graphs and day trading just as much as he enjoys his current job.
- Stock markets are weak form and semi-strong form efficient.
- He has no inside information.
- He makes 1 trade every day and there are 250 trading days in the year. Trading costs are $20 per trade. His broker invoices him for the trading costs at the end of the year.
- The shares that he currently owns and the shares that he intends to trade have the same level of systematic risk as the market portfolio.
- The market portfolio's expected return is 10% pa.
Measure the net gain over the first year as an expected wealth increase at the end of the year.
Estimate the Chinese bank ICBC's share price using a backward-looking price earnings (PE) multiples approach with the following assumptions and figures only. Note that the renminbi (RMB) is the Chinese currency, also known as the yuan (CNY).
- The 4 major Chinese banks ICBC, China Construction Bank (CCB), Bank of China (BOC) and Agricultural Bank of China (ABC) are comparable companies;
- ICBC 's historical earnings per share (EPS) is RMB 0.74;
- CCB's backward-looking PE ratio is 4.59;
- BOC 's backward-looking PE ratio is 4.78;
- ABC's backward-looking PE ratio is also 4.78;
Note: Figures sourced from Google Finance on 25 March 2014. Share prices are from the Shanghai stock exchange.
Which of the following is NOT a valid method to estimate future revenues or costs in a pro-forma income statement when trying to value a company?
Question 524 risk, expected and historical returns, bankruptcy or insolvency, capital structure, corporate financial decision theory, limited liability
Which of the following statements is NOT correct?
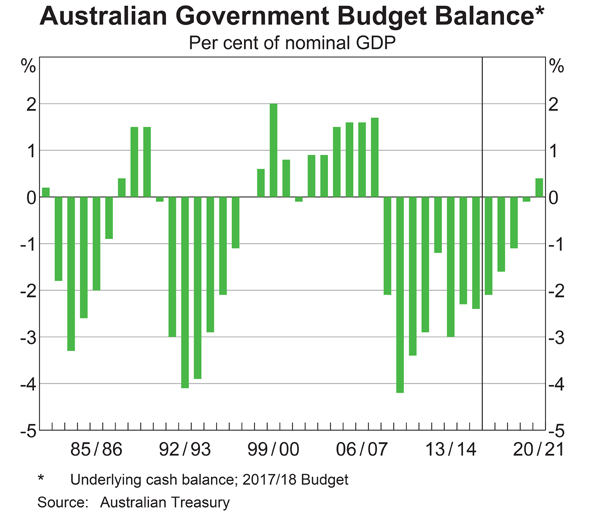
Below is the Australian federal government’s budget balance as a percent of GDP. Note that the columns to the right of the vertical black line were a forecast at the time. The x-axis shows financial years, so for example the 06/07 financial year represents the time period from 1 July 2006 to 30 June 2007.

Comparing the 2008/09 financial year to the previous one, the Australian federal government implemented: