| Portfolio Details | ||||||
| Stock | Expected return |
Standard deviation |
Covariance ##(\sigma_{A,B})## | Beta | Dollars invested |
|
| A | 0.2 | 0.4 | 0.12 | 0.5 | 40 | |
| B | 0.3 | 0.8 | 1.5 | 80 | ||
What is the standard deviation (not variance) of the above portfolio? Note that the stocks' covariance is given, not correlation.
A firm has a debt-to-assets ratio of 50%. The firm then issues a large amount of equity to raise money for new projects of similar systematic risk to the company's existing projects. Assume a classical tax system. Which statement is correct?
A project's NPV is positive. Select the most correct statement:
A firm has a debt-to-assets ratio of 20%. What is its debt-to-equity ratio?
Question 708 continuously compounding rate, continuously compounding rate conversion
Convert a 10% continuously compounded annual rate ##(r_\text{cc annual})## into an effective annual rate ##(r_\text{eff annual})##. The equivalent effective annual rate is:
Which Australian institution is in charge of monetary policy?
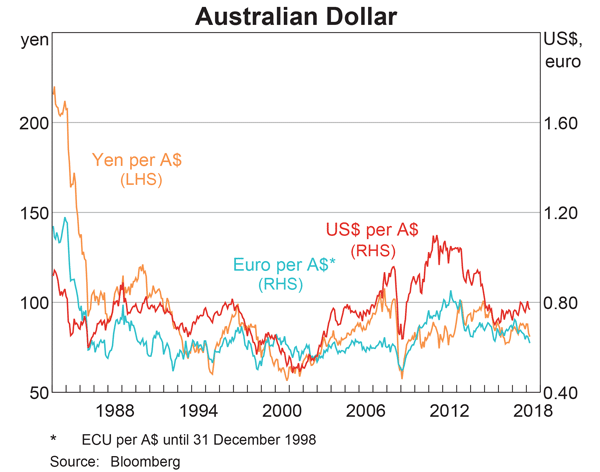
Examine the graph of the AUD versus the USD, EUR and JPY. Note that RHS means right hand side and LHS left hand side which indicates which axis each line corresponds to. Assume inflation rates in each country were equal over the time period 1984 to 2018.

Which of the following statements is NOT correct?
Question 925 mean and median returns, return distribution, arithmetic and geometric averages, continuously compounding rate, no explanation
The arithmetic average and standard deviation of returns on the ASX200 accumulation index over the 24 years from 31 Dec 1992 to 31 Dec 2016 were calculated as follows:
###\bar{r}_\text{yearly} = \dfrac{ \displaystyle\sum\limits_{t=1992}^{24}{\left( \ln \left( \dfrac{P_{t+1}}{P_t} \right) \right)} }{T} = \text{AALGDR} =0.0949=9.49\% \text{ pa}###
###\sigma_\text{yearly} = \dfrac{ \displaystyle\sum\limits_{t=1992}^{24}{\left( \left( \ln \left( \dfrac{P_{t+1}}{P_t} \right) - \bar{r}_\text{yearly} \right)^2 \right)} }{T} = \text{SDLGDR} = 0.1692=16.92\text{ pp pa}###
Assume that the log gross discrete returns are normally distributed and that the above estimates are true population statistics, not sample statistics, so there is no standard error in the sample mean or standard deviation estimates. Also assume that the standardised normal Z-statistic corresponding to a one-tail probability of 2.5% is exactly -1.96.
Which of the following statements is NOT correct? If you invested $1m today in the ASX200, then over the next 4 years: