A firm's weighted average cost of capital before tax (##r_\text{WACC before tax}##) would increase due to:
A 2 year corporate bond yields 3% pa with a coupon rate of 5% pa, paid semi-annually.
Find the effective monthly rate, effective six month rate, and effective annual rate.
##r_\text{eff monthly}##, ##r_\text{eff 6 month}##, ##r_\text{eff annual}##.
Find the sample standard deviation of returns using the data in the table:
| Stock Returns | |
| Year | Return pa |
| 2008 | 0.3 |
| 2009 | 0.02 |
| 2010 | -0.2 |
| 2011 | 0.4 |
The returns above and standard deviations below are given in decimal form.
Question 723 mean and median returns, return distribution, arithmetic and geometric averages, continuously compounding rate
Here is a table of stock prices and returns. Which of the statements below the table is NOT correct?
| Price and Return Population Statistics | ||||
| Time | Prices | LGDR | GDR | NDR |
| 0 | 100 | |||
| 1 | 99 | -0.010050 | 0.990000 | -0.010000 |
| 2 | 180.40 | 0.600057 | 1.822222 | 0.822222 |
| 3 | 112.73 | 0.470181 | 0.624889 | 0.375111 |
| Arithmetic average | 0.0399 | 1.1457 | 0.1457 | |
| Arithmetic standard deviation | 0.4384 | 0.5011 | 0.5011 | |
Question 875 omitted variable bias, systematic and idiosyncratic risk, CAPM, single factor model, two factor model
The Capital Asset Pricing Model (CAPM) and the Single Index Model (SIM) are single factor models whose only risk factor is the market portfolio’s return. Say a Solar electricity generator company and a Beach bathing chair renting company are influenced by two factors, the market portfolio return and cloud cover in the sky. When it's sunny and not cloudy, both the Solar and Beach companies’ stock prices do well. When there’s dense cloud cover and no sun, both do poorly. Assume that cloud coverage risk is a systematic risk that cannot be diversified and that cloud cover has zero correlation with the market portfolio’s returns.
Which of the following statements about these two stocks is NOT correct?
The CAPM and SIM:
Question 897 comparative advantage in trade, production possibilities curve, no explanation
Adam and Bella are the only people on a remote island. Their production possibility curves are shown in the graph.
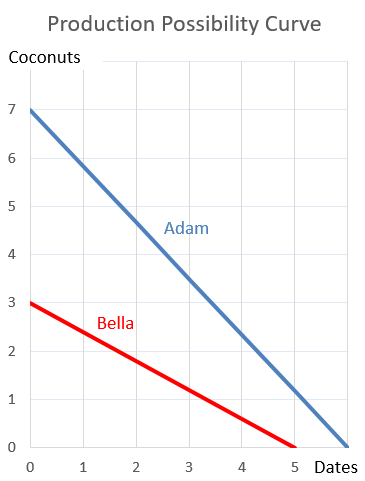
Which of the following statements is NOT correct?