| Portfolio Details | ||||||
| Stock | Expected return |
Standard deviation |
Correlation | Dollars invested |
||
| A | 0.1 | 0.4 | 0.5 | 60 | ||
| B | 0.2 | 0.6 | 140 | |||
What is the expected return of the above portfolio?
Question 119 market efficiency, fundamental analysis, joint hypothesis problem
Your friend claims that by reading 'The Economist' magazine's economic news articles, she can identify shares that will have positive abnormal expected returns over the next 2 years. Assuming that her claim is true, which statement(s) are correct?
(i) Weak form market efficiency is broken.
(ii) Semi-strong form market efficiency is broken.
(iii) Strong form market efficiency is broken.
(iv) The asset pricing model used to measure the abnormal returns (such as the CAPM) is either wrong (mis-specification error) or is measured using the wrong inputs (data errors) so the returns may not be abnormal but rather fair for the level of risk.
Select the most correct response:
Your main expense is fuel for your car which costs $100 per month. You just refueled, so you won't need any more fuel for another month (first payment at t=1 month).
You have $2,500 in a bank account which pays interest at a rate of 6% pa, payable monthly. Interest rates are not expected to change.
Assuming that you have no income, in how many months time will you not have enough money to fully refuel your car?
Three important classes of investable risky assets are:
- Corporate debt which has low total risk,
- Real estate which has medium total risk,
- Equity which has high total risk.
Assume that the correlation between total returns on:
- Corporate debt and real estate is 0.1,
- Corporate debt and equity is 0.1,
- Real estate and equity is 0.5.
You are considering investing all of your wealth in one or more of these asset classes. Which portfolio will give the lowest total risk? You are restricted from shorting any of these assets. Disregard returns and the risk-return trade-off, pretend that you are only concerned with minimising risk.
The below screenshot of Commonwealth Bank of Australia's (CBA) details were taken from the Google Finance website on 7 Nov 2014. Some information has been deliberately blanked out.
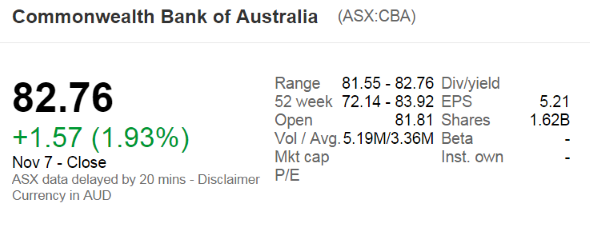
What was CBA's market capitalisation of equity?
An equity index is currently at 5,000 points. The 2 year futures price is 5,400 points and the total required return is 8% pa with continuous compounding. Each index point is worth $25.
What is the implied continuous dividend yield as a continuously compounded rate per annum?
A stock has a beta of 1.5. The market's expected total return is 10% pa and the risk free rate is 5% pa, both given as effective annual rates.
What do you think will be the stock's expected return over the next year, given as an effective annual rate?
Question 728 inflation, real and nominal returns and cash flows, income and capital returns, no explanation
Which of the following statements about gold is NOT correct? Assume that the gold price increases by inflation. Gold has a:
Question 792 mean and median returns, return distribution, arithmetic and geometric averages, continuously compounding rate, log-normal distribution, confidence interval
A risk manager has identified that their investment fund’s continuously compounded portfolio returns are normally distributed with a mean of 10% pa and a standard deviation of 40% pa. The fund’s portfolio is currently valued at $1 million. Assume that there is no estimation error in the above figures. To simplify your calculations, all answers below use 2.33 as an approximation for the normal inverse cumulative density function at 99%. All answers are rounded to the nearest dollar. Assume one month is 1/12 of a year. Which of the following statements is NOT correct?
Question 925 mean and median returns, return distribution, arithmetic and geometric averages, continuously compounding rate, no explanation
The arithmetic average and standard deviation of returns on the ASX200 accumulation index over the 24 years from 31 Dec 1992 to 31 Dec 2016 were calculated as follows:
###\bar{r}_\text{yearly} = \dfrac{ \displaystyle\sum\limits_{t=1992}^{24}{\left( \ln \left( \dfrac{P_{t+1}}{P_t} \right) \right)} }{T} = \text{AALGDR} =0.0949=9.49\% \text{ pa}###
###\sigma_\text{yearly} = \dfrac{ \displaystyle\sum\limits_{t=1992}^{24}{\left( \left( \ln \left( \dfrac{P_{t+1}}{P_t} \right) - \bar{r}_\text{yearly} \right)^2 \right)} }{T} = \text{SDLGDR} = 0.1692=16.92\text{ pp pa}###
Assume that the log gross discrete returns are normally distributed and that the above estimates are true population statistics, not sample statistics, so there is no standard error in the sample mean or standard deviation estimates. Also assume that the standardised normal Z-statistic corresponding to a one-tail probability of 2.5% is exactly -1.96.
Which of the following statements is NOT correct? If you invested $1m today in the ASX200, then over the next 4 years: