| Portfolio Details | ||||||
| Stock | Expected return |
Standard deviation |
Correlation | Dollars invested |
||
| A | 0.1 | 0.4 | 0.5 | 60 | ||
| B | 0.2 | 0.6 | 140 | |||
What is the expected return of the above portfolio?
The Australian cash rate is expected to be 6% pa while the US federal funds rate is expected to be 4% pa over the next 3 years, both given as effective annual rates. The current exchange rate is 0.80 AUD per USD.
What is the implied 3 year forward foreign exchange rate?
Estimate the French bank Societe Generale's share price using a backward-looking price earnings (PE) multiples approach with the following assumptions and figures only. Note that EUR is the euro, the European monetary union's currency.
- The 4 major European banks Credit Agricole (ACA), Deutsche Bank AG (DBK), UniCredit (UCG) and Banco Santander (SAN) are comparable companies to Societe Generale (GLE);
- Societe Generale's (GLE's) historical earnings per share (EPS) is EUR 2.92;
- ACA's backward-looking PE ratio is 16.29 and historical EPS is EUR 0.84;
- DBK's backward-looking PE ratio is 25.01 and historical EPS is EUR 1.26;
- SAN's backward-looking PE ratio is 14.71 and historical EPS is EUR 0.47;
- UCG's backward-looking PE ratio is 15.78 and historical EPS is EUR 0.40;
Note: Figures sourced from Google Finance on 27 March 2015.
A Chinese man wishes to convert AUD 1 million into Chinese Renminbi (RMB, also called the Yuan (CNY)). The exchange rate is 6.35 RMB per USD, and 0.72 USD per AUD. How much is the AUD 1 million worth in RMB?
A stock's required total return will increase when its:
Question 749 Multiples valuation, PE ratio, price to revenue ratio, price to book ratio, NPV
A real estate agent says that the price of a house in Sydney Australia is approximately equal to the gross weekly rent times 1000.
What type of valuation method is the real estate agent using?
Question 948 VaR, expected shortfall
Below is a historical sample of returns on the S&P500 capital index.
| S&P500 Capital Index Daily Returns Ranked from Best to Worst |
||
| 10,000 trading days from 4th August 1977 to 24 March 2017 based on closing prices. |
||
| Rank | Date (DD-MM-YY) |
Continuously compounded daily return (% per day) |
| 1 | 21-10-87 | 9.23 |
| 2 | 08-03-83 | 8.97 |
| 3 | 13-11-08 | 8.3 |
| 4 | 30-09-08 | 8.09 |
| 5 | 28-10-08 | 8.01 |
| 6 | 29-10-87 | 7.28 |
| … | … | … |
| 9980 | 11-12-08 | -5.51 |
| 9981 | 22-10-08 | -5.51 |
| 9982 | 08-08-11 | -5.54 |
| 9983 | 22-09-08 | -5.64 |
| 9984 | 11-09-86 | -5.69 |
| 9985 | 30-11-87 | -5.88 |
| 9986 | 14-04-00 | -5.99 |
| 9987 | 07-10-98 | -6.06 |
| 9988 | 08-01-88 | -6.51 |
| 9989 | 27-10-97 | -6.55 |
| 9990 | 13-10-89 | -6.62 |
| 9991 | 15-10-08 | -6.71 |
| 9992 | 29-09-08 | -6.85 |
| 9993 | 07-10-08 | -6.91 |
| 9994 | 14-11-08 | -7.64 |
| 9995 | 01-12-08 | -7.79 |
| 9996 | 29-10-08 | -8.05 |
| 9997 | 26-10-87 | -8.4 |
| 9998 | 31-08-98 | -8.45 |
| 9999 | 09-10-08 | -12.9 |
| 10000 | 19-10-87 | -23.36 |
| Mean of all 10,000: | 0.0354 | |
| Sample standard deviation of all 10,000: | 1.2062 | |
| Sources: Bloomberg and S&P. | ||
Assume that the one-tail Z-statistic corresponding to a probability of 99.9% is exactly 3.09. Which of the following statements is NOT correct? Based on the historical data, the 99.9% daily:
A Malaysian man wishes to convert 1 million Malaysian Ringgit (MYR) into Indian Rupees (IND). The exchange rate is 4.2 MYR per USD and 71 IND per USD. How much is the MYR 1 million worth in IND?
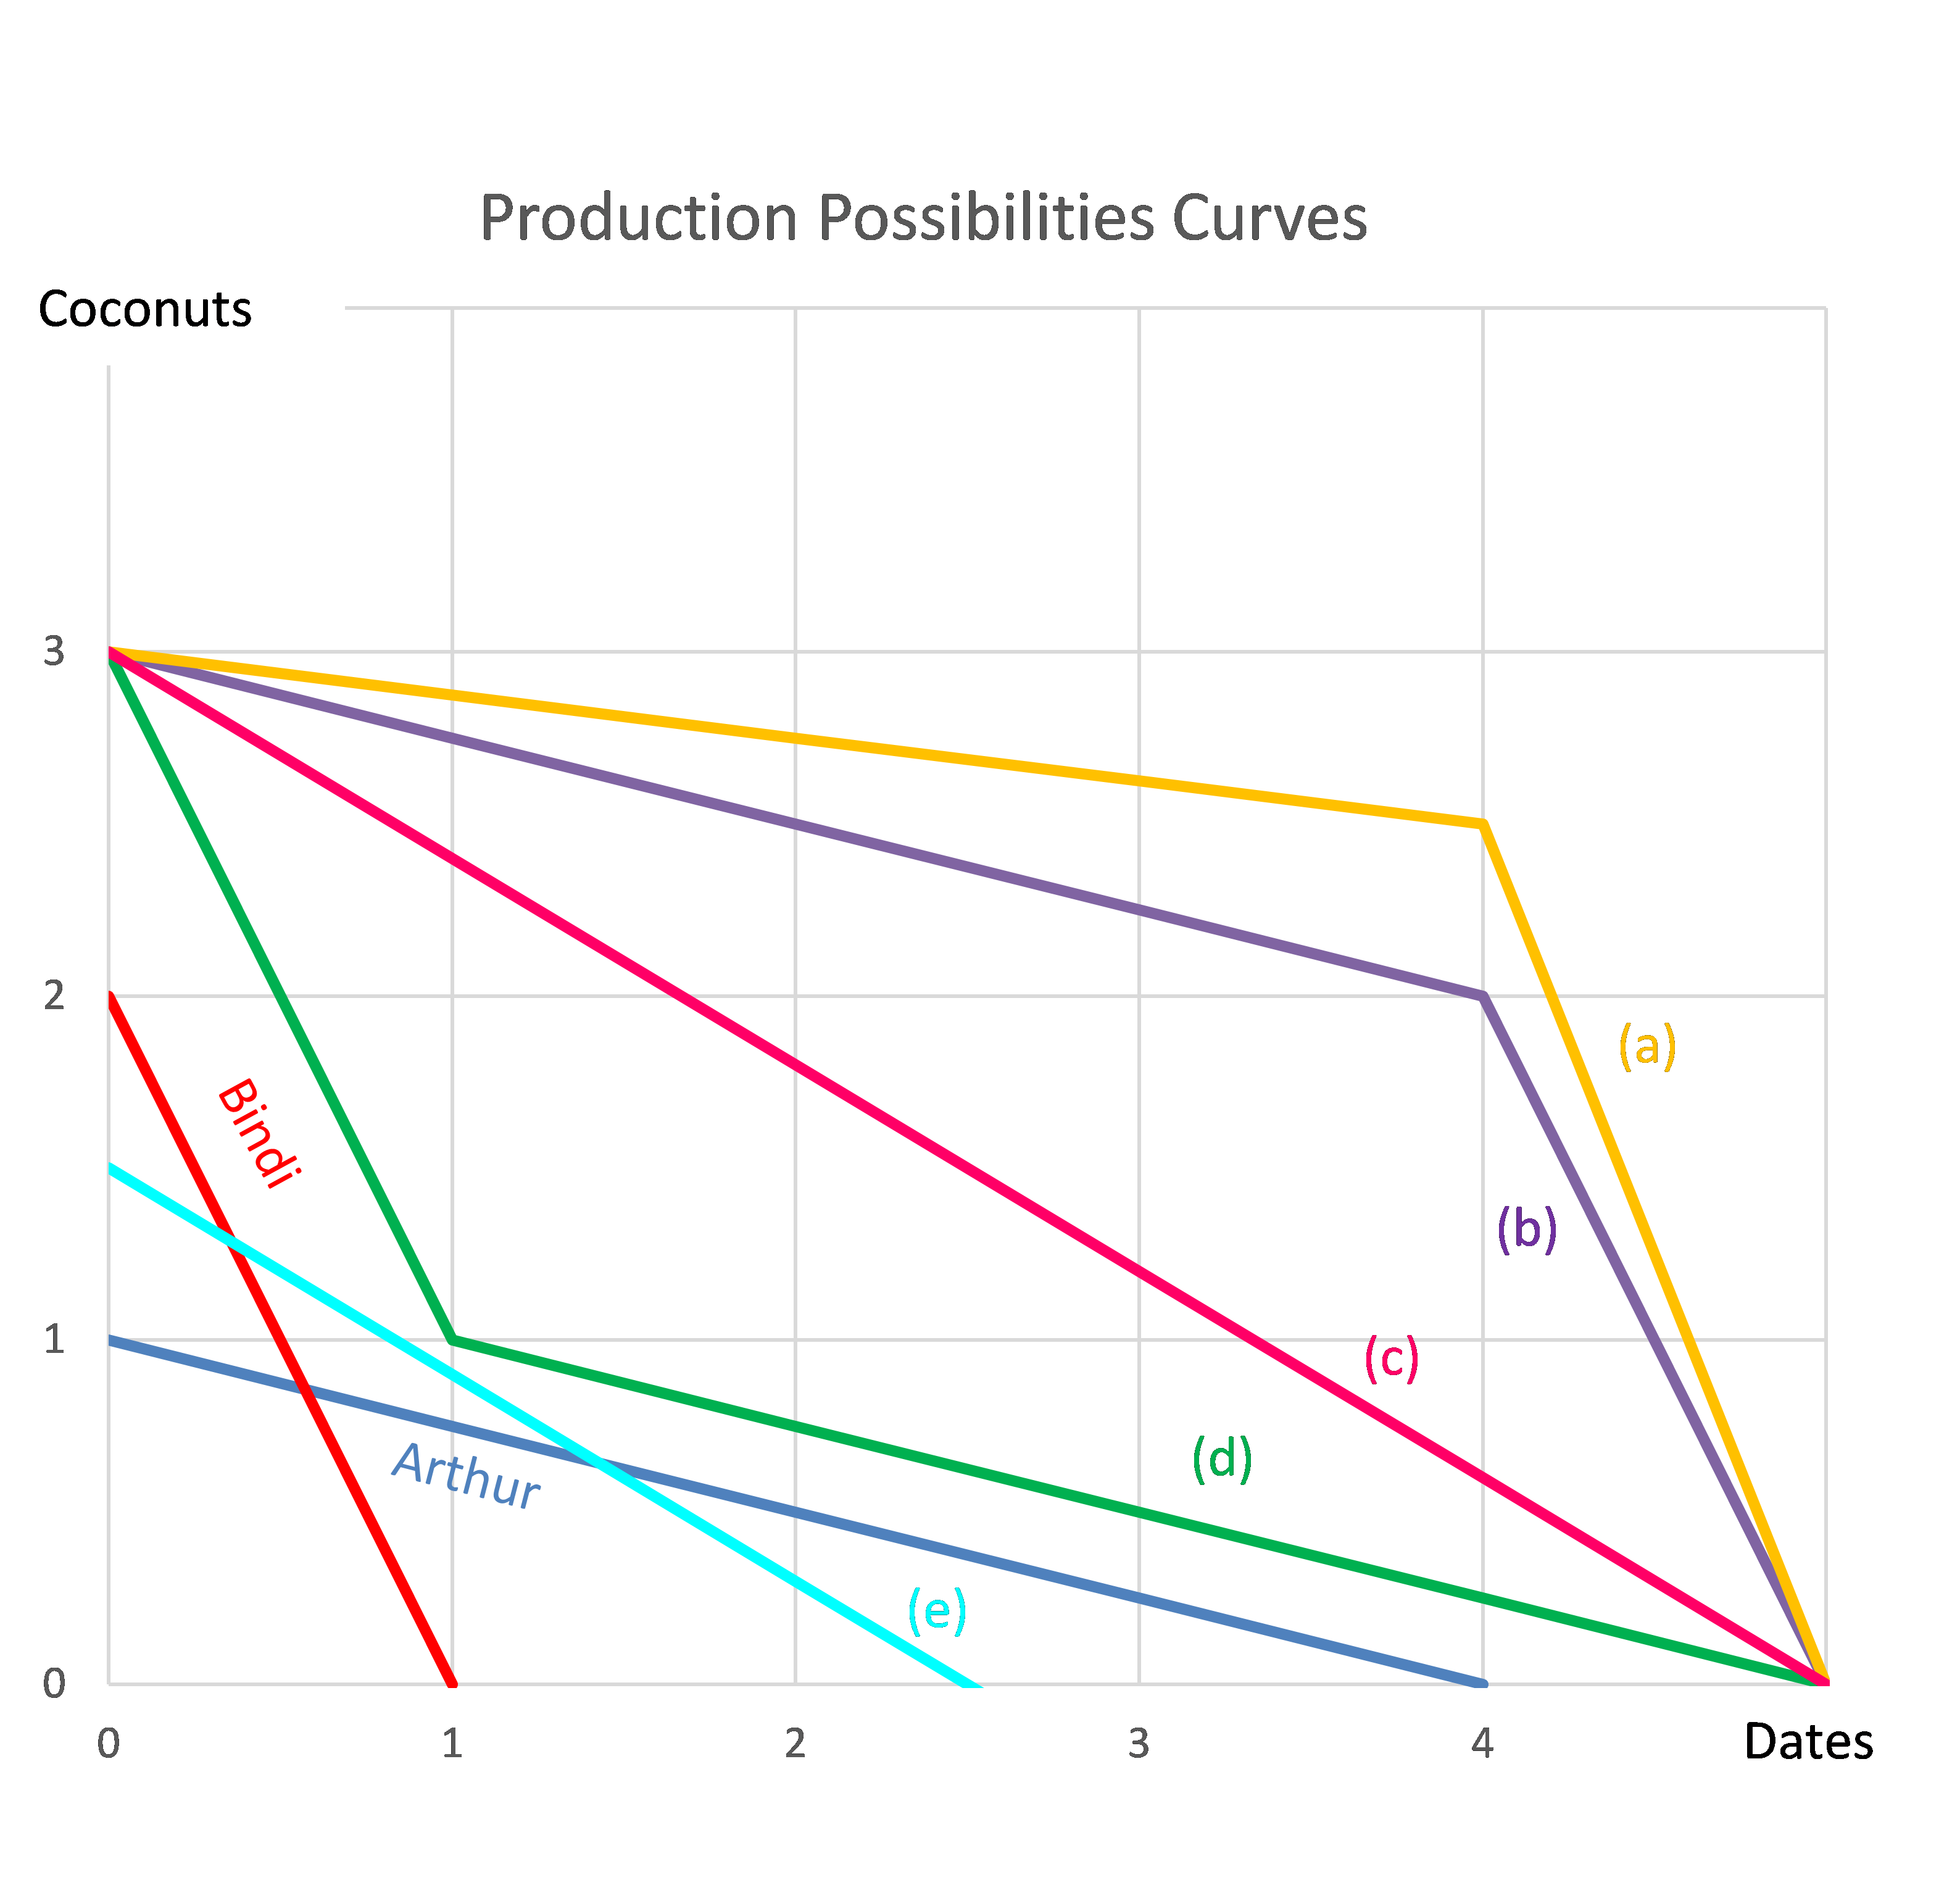
Question 978 comparative advantage in trade, production possibilities curve, no explanation
Arthur and Bindi are the only people on a remote island. Their production possibility curves are shown in the graph.
Assuming that Arthur and Bindi cooperate according to the principles of comparative advantage, what will be their combined production possibilities curve?