For a price of $129, Joanne will sell you a share which is expected to pay a $30 dividend in one year, and a $10 dividend every year after that forever. So the stock's dividends will be $30 at t=1, $10 at t=2, $10 at t=3, and $10 forever onwards.
The required return of the stock is 10% pa.
Question 25 bond pricing, zero coupon bond, term structure of interest rates, forward interest rate
A European company just issued two bonds, a
- 2 year zero coupon bond at a yield of 8% pa, and a
- 3 year zero coupon bond at a yield of 10% pa.
What is the company's forward rate over the third year (from t=2 to t=3)? Give your answer as an effective annual rate, which is how the above bond yields are quoted.
Bonds X and Y are issued by different companies, but they both pay a semi-annual coupon of 10% pa and they have the same face value ($100), maturity (3 years) and yield (10%) as each other.
Which of the following statements is true?
An industrial chicken farmer grows chickens for their meat. Chickens:
- Cost $0.50 each to buy as chicks. They are bought on the day they’re born, at t=0.
- Grow at a rate of $0.70 worth of meat per chicken per week for the first 6 weeks (t=0 to t=6).
- Grow at a rate of $0.40 worth of meat per chicken per week for the next 4 weeks (t=6 to t=10) since they’re older and grow more slowly.
- Feed costs are $0.30 per chicken per week for their whole life. Chicken feed is bought and fed to the chickens once per week at the beginning of the week. So the first amount of feed bought for a chicken at t=0 costs $0.30, and so on.
- Can be slaughtered (killed for their meat) and sold at no cost at the end of the week. The price received for the chicken is their total value of meat (note that the chicken grows fast then slow, see above).
The required return of the chicken farm is 0.5% given as an effective weekly rate.
Ignore taxes and the fixed costs of the factory. Ignore the chicken’s welfare and other environmental and ethical concerns.
Find the equivalent weekly cash flow of slaughtering a chicken at 6 weeks and at 10 weeks so the farmer can figure out the best time to slaughter his chickens. The choices below are given in the same order, 6 and 10 weeks.
Question 241 Miller and Modigliani, leverage, payout policy, diversification, NPV
One of Miller and Modigliani's (M&M's) important insights is that a firm's managers should not try to achieve a particular level of leverage in a world with zero taxes and perfect information since investors can make their own leverage. Therefore corporate capital structure policy is irrelevant since investors can achieve their own desired leverage at the personal level by borrowing or lending on their own.
This principal of 'home-made' or 'do-it-yourself' leverage can also be applied to other topics. Read the following statements to decide which are true:
(I) Payout policy: a firm's managers should not try to achieve a particular pattern of equity payout.
(II) Agency costs: a firm's managers should not try to minimise agency costs.
(III) Diversification: a firm's managers should not try to diversify across industries.
(IV) Shareholder wealth: a firm's managers should not try to maximise shareholders' wealth.
Which of the above statement(s) are true?
The below screenshot of Commonwealth Bank of Australia's (CBA) details were taken from the Google Finance website on 7 Nov 2014. Some information has been deliberately blanked out.
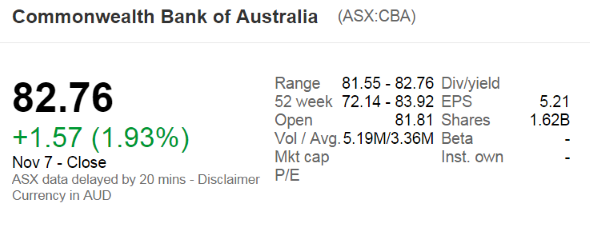
What was CBA's backwards-looking price-earnings ratio?
To value a business's assets, the free cash flow of the firm (FCFF, also called CFFA) needs to be calculated. This requires figures from the firm's income statement and balance sheet. For what figures is the balance sheet needed? Note that the balance sheet is sometimes also called the statement of financial position.
An equity index is currently at 5,200 points. The 6 month futures price is 5,300 points and the total required return is 6% pa with continuous compounding. Each index point is worth $25.
What is the implied dividend yield as a continuously compounded rate per annum?
Question 850 gross domestic product, gross domestic product per capita
Below is a table showing some countries’ GDP, population and GDP per capita.
| Countries' GDP and Population | |||
| GDP | Population | GDP per capita | |
| USD million | millions of people | USD | |
| United States | 18,036,648 | 325 | 55,492 |
| China | 11,158,457 | 1,383 | 8,066 |
| Japan | 4,383,076 | 127 | 34,586 |
| Germany | 3,363,600 | 83 | 40,623 |
| Norway | 500,519 | 5 | 95,027 |
Source: "GDP and its breakdown at current prices in US Dollars" United Nations Statistics Division. December 2016.
Using this data only, which one of these countries’ citizens have the highest living standards?