For a price of $129, Joanne will sell you a share which is expected to pay a $30 dividend in one year, and a $10 dividend every year after that forever. So the stock's dividends will be $30 at t=1, $10 at t=2, $10 at t=3, and $10 forever onwards.
The required return of the stock is 10% pa.
Question 65 annuity with growth, needs refinement
Which of the below formulas gives the present value of an annuity with growth?
Hint: The equation of a perpetuity without growth is: ###V_\text{0, perp without growth} = \frac{C_\text{1}}{r}###
The formula for the present value of an annuity without growth is derived from the formula for a perpetuity without growth.
The idea is than an annuity with T payments from t=1 to T inclusive is equivalent to a perpetuity starting at t=1 with fixed positive cash flows, plus a perpetuity starting T periods later (t=T+1) with fixed negative cash flows. The positive and negative cash flows after time period T cancel each other out, leaving the positive cash flows between t=1 to T, which is the annuity.
###\begin{aligned} V_\text{0, annuity} &= V_\text{0, perp without growth from t=1} - V_\text{0, perp without growth from t=T+1} \\ &= \dfrac{C_\text{1}}{r} - \dfrac{ \left( \dfrac{C_\text{T+1}}{r} \right) }{(1+r)^T} \\ &= \dfrac{C_\text{1}}{r} - \dfrac{ \left( \dfrac{C_\text{1}}{r} \right) }{(1+r)^T} \\ &= \dfrac{C_\text{1}}{r}\left(1 - \dfrac{1}{(1+r)^T}\right) \\ \end{aligned}###
The equation of a perpetuity with growth is:
###V_\text{0, perp with growth} = \dfrac{C_\text{1}}{r-g}###Find Piano Bar's Cash Flow From Assets (CFFA), also known as Free Cash Flow to the Firm (FCFF), over the year ending 30th June 2013.
| Piano Bar | ||
| Income Statement for | ||
| year ending 30th June 2013 | ||
| $m | ||
| Sales | 310 | |
| COGS | 185 | |
| Operating expense | 20 | |
| Depreciation | 15 | |
| Interest expense | 10 | |
| Income before tax | 80 | |
| Tax at 30% | 24 | |
| Net income | 56 | |
| Piano Bar | ||
| Balance Sheet | ||
| as at 30th June | 2013 | 2012 |
| $m | $m | |
| Assets | ||
| Current assets | 240 | 230 |
| PPE | ||
| Cost | 420 | 400 |
| Accumul. depr. | 50 | 35 |
| Carrying amount | 370 | 365 |
| Total assets | 610 | 595 |
| Liabilities | ||
| Current liabilities | 180 | 190 |
| Non-current liabilities | 290 | 265 |
| Owners' equity | ||
| Retained earnings | 90 | 90 |
| Contributed equity | 50 | 50 |
| Total L and OE | 610 | 595 |
Note: all figures are given in millions of dollars ($m).
Three important classes of investable risky assets are:
- Corporate debt which has low total risk,
- Real estate which has medium total risk,
- Equity which has high total risk.
Assume that the correlation between total returns on:
- Corporate debt and real estate is 0.1,
- Corporate debt and equity is 0.1,
- Real estate and equity is 0.5.
You are considering investing all of your wealth in one or more of these asset classes. Which portfolio will give the lowest total risk? You are restricted from shorting any of these assets. Disregard returns and the risk-return trade-off, pretend that you are only concerned with minimising risk.
Question 322 foreign exchange rate, monetary policy, American and European terms
The market expects the Reserve Bank of Australia (RBA) to decrease the policy rate by 25 basis points at their next meeting.
Then unexpectedly, the RBA announce that they will decrease the policy rate by 50 basis points due to fears of a recession and deflation.
What do you expect to happen to Australia's exchange rate? The Australian dollar will:
There are many ways to calculate a firm's free cash flow (FFCF), also called cash flow from assets (CFFA). Some include the annual interest tax shield in the cash flow and some do not.
Which of the below FFCF formulas include the interest tax shield in the cash flow?
###(1) \quad FFCF=NI + Depr - CapEx -ΔNWC + IntExp### ###(2) \quad FFCF=NI + Depr - CapEx -ΔNWC + IntExp.(1-t_c)### ###(3) \quad FFCF=EBIT.(1-t_c )+ Depr- CapEx -ΔNWC+IntExp.t_c### ###(4) \quad FFCF=EBIT.(1-t_c) + Depr- CapEx -ΔNWC### ###(5) \quad FFCF=EBITDA.(1-t_c )+Depr.t_c- CapEx -ΔNWC+IntExp.t_c### ###(6) \quad FFCF=EBITDA.(1-t_c )+Depr.t_c- CapEx -ΔNWC### ###(7) \quad FFCF=EBIT-Tax + Depr - CapEx -ΔNWC### ###(8) \quad FFCF=EBIT-Tax + Depr - CapEx -ΔNWC-IntExp.t_c### ###(9) \quad FFCF=EBITDA-Tax - CapEx -ΔNWC### ###(10) \quad FFCF=EBITDA-Tax - CapEx -ΔNWC-IntExp.t_c###The formulas for net income (NI also called earnings), EBIT and EBITDA are given below. Assume that depreciation and amortisation are both represented by 'Depr' and that 'FC' represents fixed costs such as rent.
###NI=(Rev - COGS - Depr - FC - IntExp).(1-t_c )### ###EBIT=Rev - COGS - FC-Depr### ###EBITDA=Rev - COGS - FC### ###Tax =(Rev - COGS - Depr - FC - IntExp).t_c= \dfrac{NI.t_c}{1-t_c}###High risk firms in danger of bankruptcy tend to have:
A 90 day bank bill has a face value of $100,000.
Investor A bought the bill when it was first issued at a simple yield to maturity of 3% pa and sold it 20 days later to Investor B who expected to earn a simple yield to maturity of 5% pa. Investor B held it until maturity.
Which of the following statements is NOT correct?
| Major City Apartment Prices | |||
| One bedroom, one bathroom, around 55 square metre floor space, Dec 2018 | |||
| City | Advertised price | Currency | FX quote |
| London, Great Britain | 995,500 | GBP | 1.3 USD per GBP |
| Paris, France | 639,000 | EUR | 0.88 USD per EUR |
| San Francisco, USA | 859,000 | USD | 1 USD per USD |
| Shanghai, China | 6,300,000 | RMB | 6.9 RMB per USD |
| Sydney, Australia | 670,000 | AUD | 0.72 USD per AUD |
| Tokyo, Japan | 50,800,000 | JPY | 112 JPY per USD |
Which city has the most expensive apartment, measured in United States Dollars (USD)? Pay attention to the FX quotes.
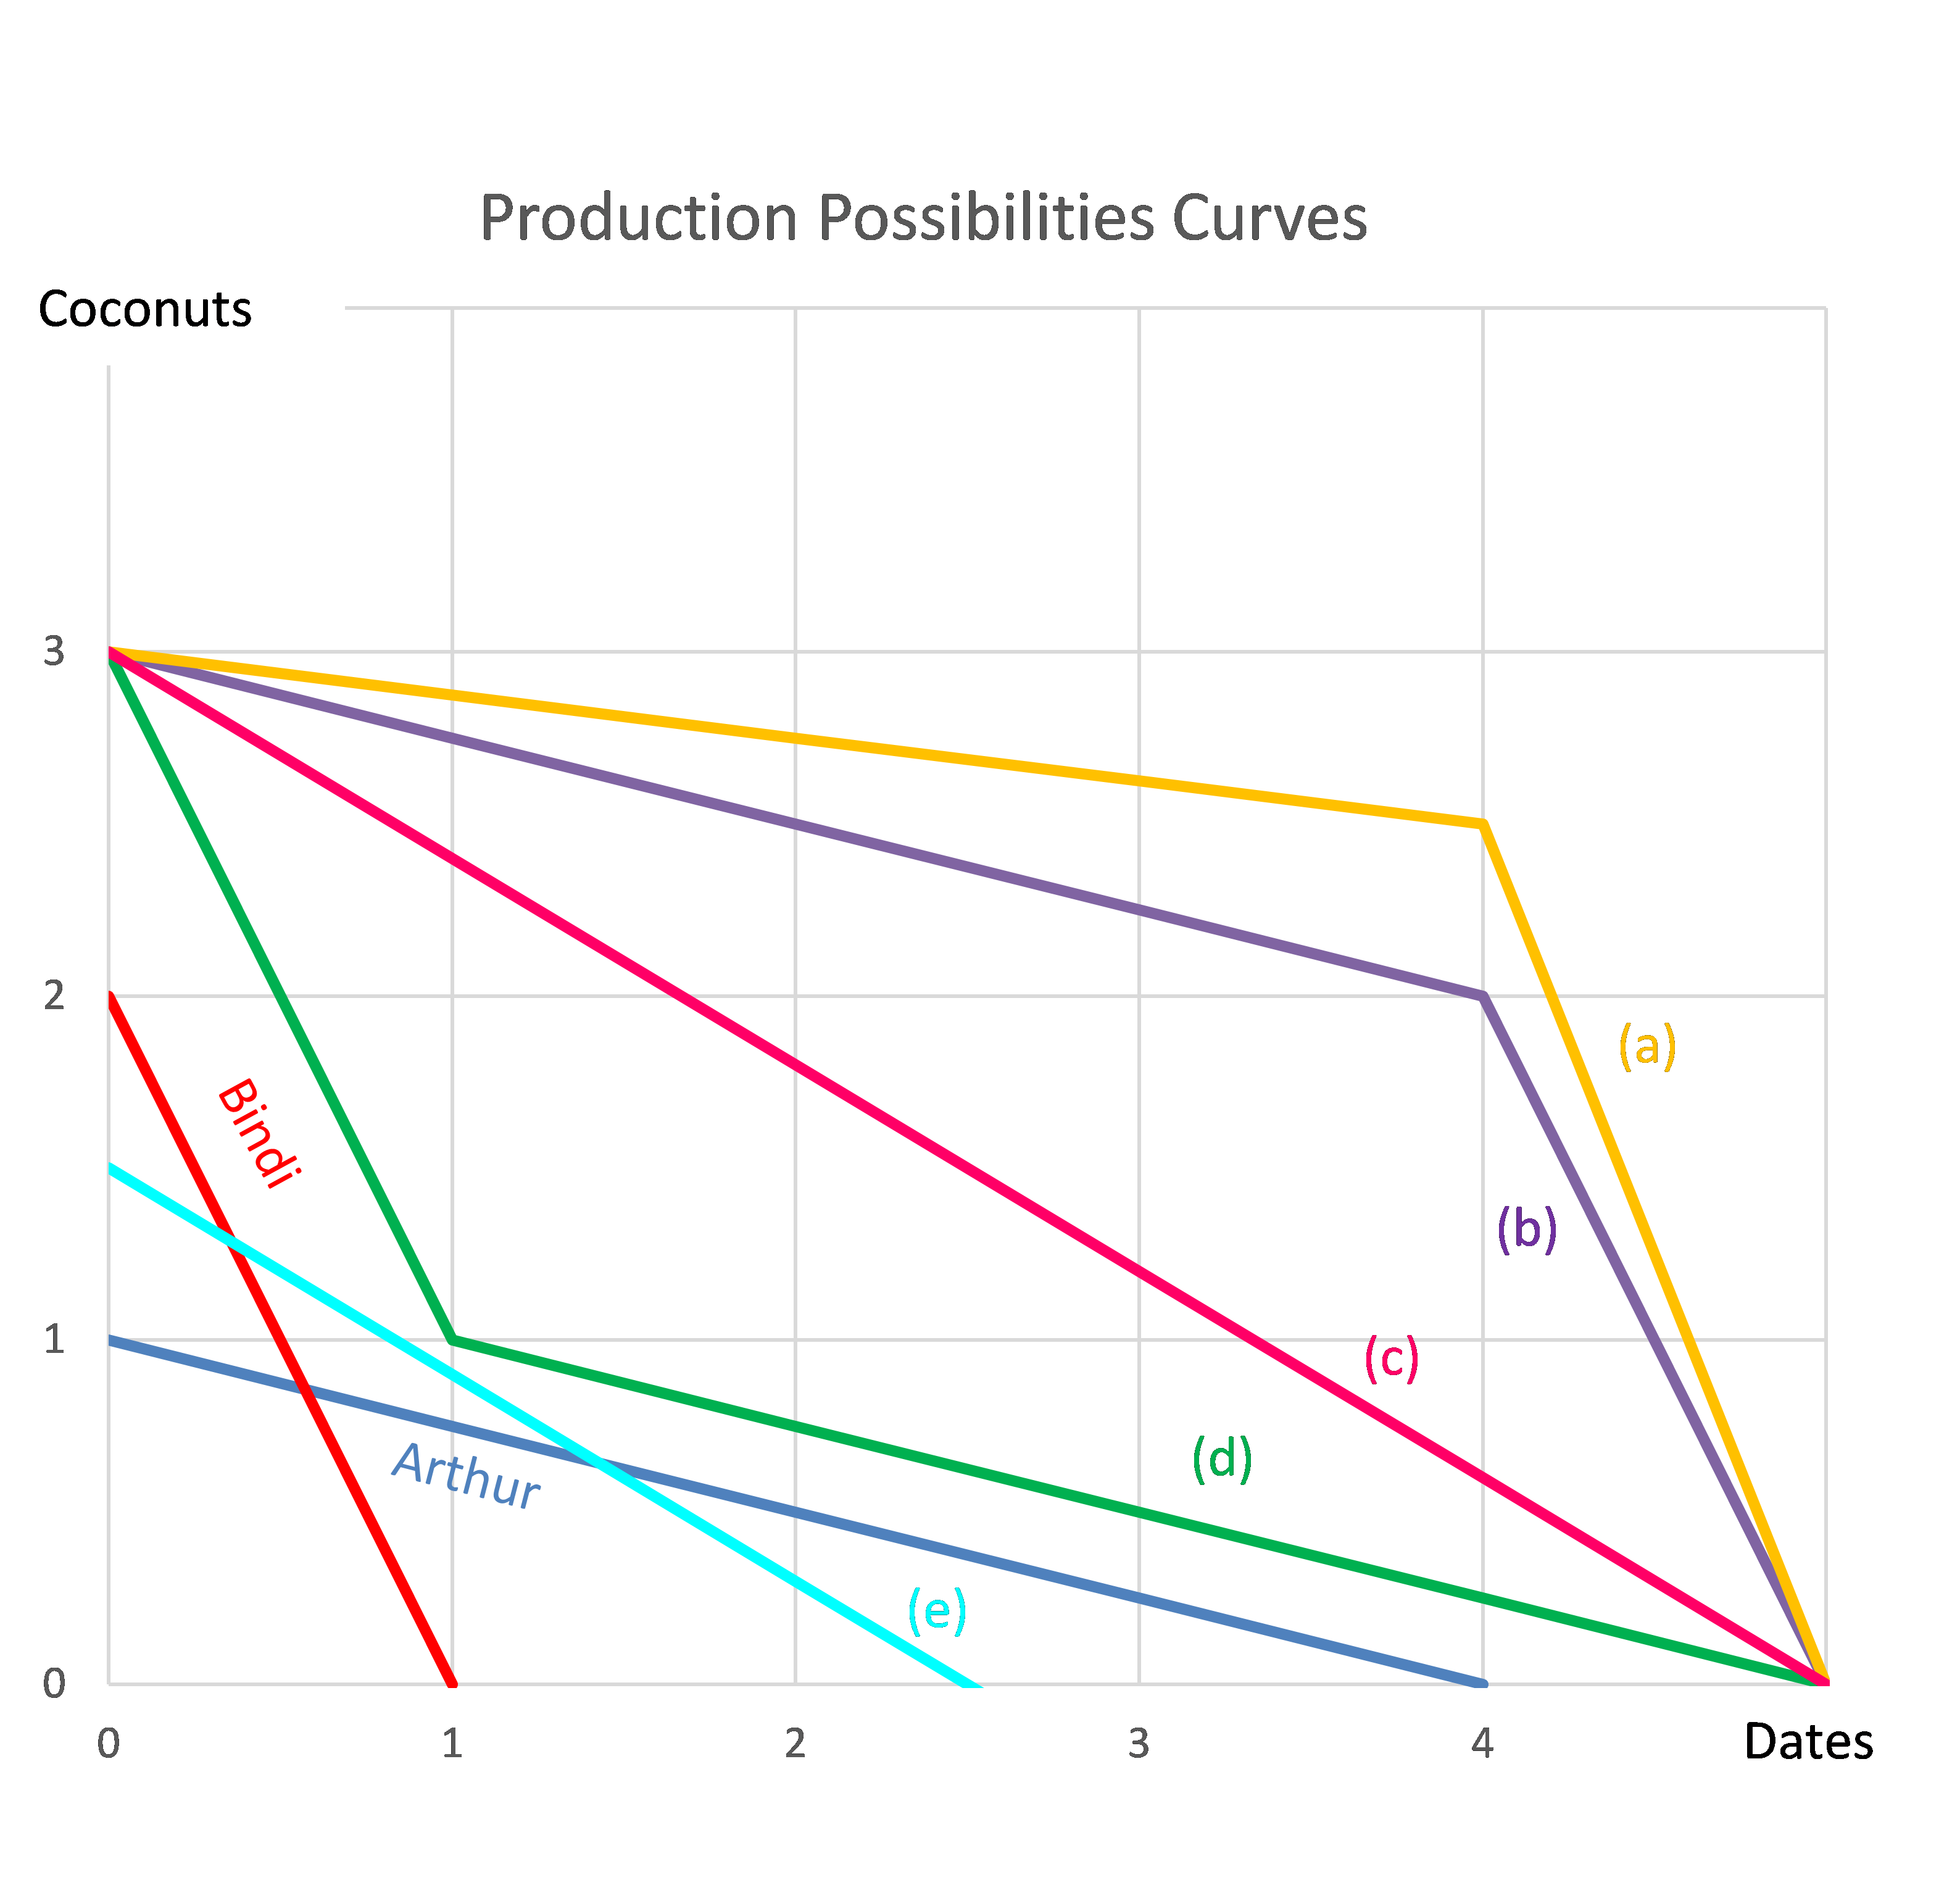
Question 978 comparative advantage in trade, production possibilities curve, no explanation
Arthur and Bindi are the only people on a remote island. Their production possibility curves are shown in the graph.
Assuming that Arthur and Bindi cooperate according to the principles of comparative advantage, what will be their combined production possibilities curve?