A company has:
- 10 million common shares outstanding, each trading at a price of $90.
- 1 million preferred shares which have a face (or par) value of $100 and pay a constant dividend of 9% of par. They currently trade at a price of $120 each.
- Debentures that have a total face value of $60,000,000 and a yield to maturity of 6% per annum. They are publicly traded and their market price is equal to 90% of their face value.
- The risk-free rate is 5% and the market return is 10%.
- Market analysts estimate that the company's common stock has a beta of 1.2. The corporate tax rate is 30%.
What is the company's after-tax Weighted Average Cost of Capital (WACC)? Assume a classical tax system.
A company increases the proportion of debt funding it uses to finance its assets by issuing bonds and using the cash to repurchase stock, leaving assets unchanged.
Ignoring the costs of financial distress, which of the following statements is NOT correct:
An economy has only two investable assets: stocks and cash.
Stocks had a historical nominal average total return of negative two percent per annum (-2% pa) over the last 20 years. Stocks are liquid and actively traded. Stock returns are variable, they have risk.
Cash is riskless and has a nominal constant return of zero percent per annum (0% pa), which it had in the past and will have in the future. Cash can be kept safely at zero cost. Cash can be converted into shares and vice versa at zero cost.
The nominal total return of the shares over the next year is expected to be:
Which of the below formulas gives the profit ##(\pi)## from being short a call option? Let the underlying asset price at maturity be ##S_T##, the exercise price be ##X_T## and the option price be ##f_{LC,0}##. Note that ##S_T##, ##X_T## and ##f_{LC,0}## are all positive numbers.
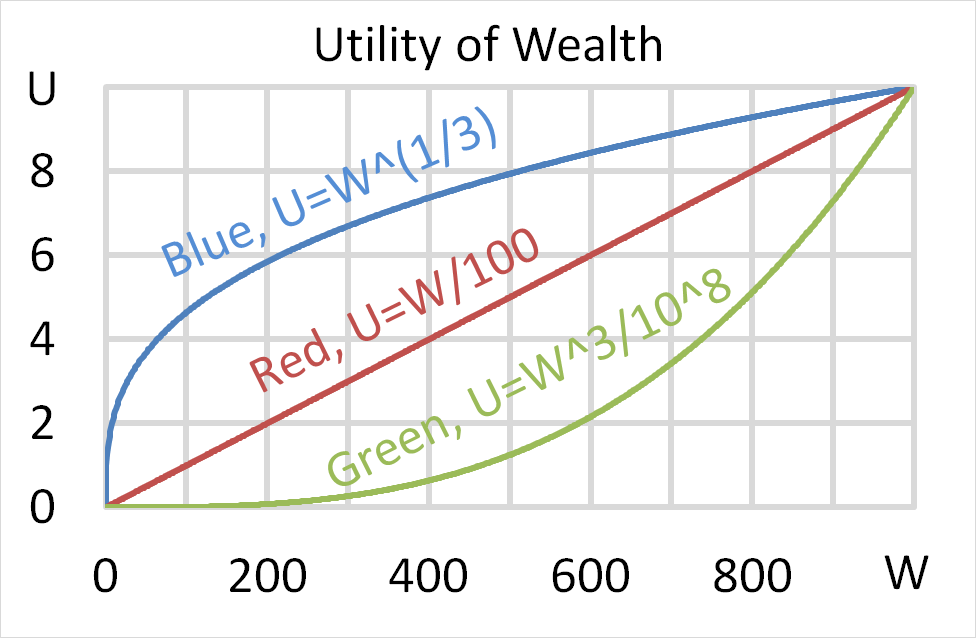
Mr Blue, Miss Red and Mrs Green are people with different utility functions. Which of the statements about the 3 utility functions is NOT correct?
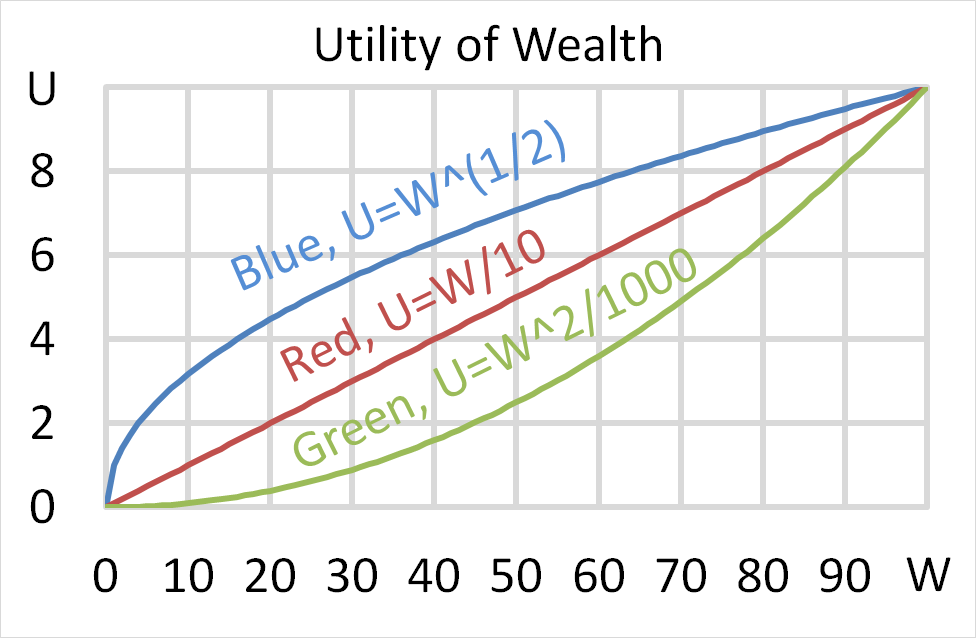
Question 704 utility, risk aversion, utility function, gamble
Mr Blue, Miss Red and Mrs Green are people with different utility functions.
Each person has $256 of initial wealth. A coin toss game is offered to each person at a casino where the player can win or lose $256. Each player can flip a coin and if they flip heads, they receive $256. If they flip tails then they will lose $256. Which of the following statements is NOT correct?
A share’s current price is $60. It’s expected to pay a dividend of $1.50 in one year. The growth rate of the dividend is 0.5% pa and the stock’s required total return is 3% pa. The stock’s price can be modeled using the dividend discount model (DDM):
##P_0=\dfrac{C_1}{r-g}##
Which of the following methods is NOT equal to the stock’s expected price in one year and six months (t=1.5 years)? Note that the symbolic formulas shown in each line below do equal the formulas with numbers. The formula is just repeated with symbols and then numbers in case it helps you to identify the incorrect statement more quickly.
The market's expected total return is 10% pa and the risk free rate is 5% pa, both given as effective annual rates.
A stock has a beta of 0.5.
In the last 5 minutes, the federal government unexpectedly raised taxes. Over this time the share market fell by 3%. The risk free rate was unchanged.
What do you think was the stock's historical return over the last 5 minutes, given as an effective 5 minute rate?
Question 850 gross domestic product, gross domestic product per capita
Below is a table showing some countries’ GDP, population and GDP per capita.
| Countries' GDP and Population | |||
| GDP | Population | GDP per capita | |
| USD million | millions of people | USD | |
| United States | 18,036,648 | 325 | 55,492 |
| China | 11,158,457 | 1,383 | 8,066 |
| Japan | 4,383,076 | 127 | 34,586 |
| Germany | 3,363,600 | 83 | 40,623 |
| Norway | 500,519 | 5 | 95,027 |
Source: "GDP and its breakdown at current prices in US Dollars" United Nations Statistics Division. December 2016.
Using this data only, which one of these countries’ citizens have the highest living standards?