A firm changes its capital structure by issuing a large amount of debt and using the funds to repurchase shares. Its assets are unchanged. Ignore interest tax shields.
According to the Capital Asset Pricing Model (CAPM), which statement is correct?
A 2 year government bond yields 5% pa with a coupon rate of 6% pa, paid semi-annually.
Find the effective six month rate, effective annual rate and the effective daily rate. Assume that each month has 30 days and that there are 360 days in a year.
All answers are given in the same order:
##r_\text{eff semi-annual}##, ##r_\text{eff yrly}##, ##r_\text{eff daily}##.
A highly levered risky firm is trying to raise more debt. The types of debt being considered, in no particular order, are senior bonds, junior bonds, bank accepted bills, promissory notes and bank loans.
Which of these forms of debt is the safest from the perspective of the debt investors who are thinking of investing in the firm's new debt?
In late 2003 the listed bank ANZ announced a 2-for-11 rights issue to fund the takeover of New Zealand bank NBNZ. Below is the chronology of events:
- 23/10/2003. Share price closes at $18.30.
- 24/10/2003. 2-for-11 rights issue announced at a subscription price of $13. The proceeds of the rights issue will be used to acquire New Zealand bank NBNZ. Trading halt announced in morning before market opens.
- 28/10/2003. Trading halt lifted. Last (and only) day that shares trade cum-rights. Share price opens at $18.00 and closes at $18.14.
- 29/10/2003. Shares trade ex-rights.
All things remaining equal, what would you expect ANZ's stock price to open at on the first day that it trades ex-rights (29/10/2003)? Ignore the time value of money since time is negligibly short. Also ignore taxes.
In the dividend discount model:
### P_0= \frac{d_1}{r-g} ###
The pronumeral ##g## is supposed to be the:
Question 413 CFFA, interest tax shield, depreciation tax shield
There are many ways to calculate a firm's free cash flow (FFCF), also called cash flow from assets (CFFA).
One method is to use the following formulas to transform net income (NI) into FFCF including interest and depreciation tax shields:
###FFCF=NI + Depr - CapEx -ΔNWC + IntExp###
###NI=(Rev - COGS - Depr - FC - IntExp).(1-t_c )###
Another popular method is to use EBITDA rather than net income. EBITDA is defined as:
###EBITDA=Rev - COGS - FC###
One of the below formulas correctly calculates FFCF from EBITDA, including interest and depreciation tax shields, giving an identical answer to that above. Which formula is correct?
Question 721 mean and median returns, return distribution, arithmetic and geometric averages, continuously compounding rate
Fred owns some Commonwealth Bank (CBA) shares. He has calculated CBA’s monthly returns for each month in the past 20 years using this formula:
###r_\text{t monthly}=\ln \left( \dfrac{P_t}{P_{t-1}} \right)###He then took the arithmetic average and found it to be 1% per month using this formula:
###\bar{r}_\text{monthly}= \dfrac{ \displaystyle\sum\limits_{t=1}^T{\left( r_\text{t monthly} \right)} }{T} =0.01=1\% \text{ per month}###He also found the standard deviation of these monthly returns which was 5% per month:
###\sigma_\text{monthly} = \dfrac{ \displaystyle\sum\limits_{t=1}^T{\left( \left( r_\text{t monthly} - \bar{r}_\text{monthly} \right)^2 \right)} }{T} =0.05=5\%\text{ per month}###Which of the below statements about Fred’s CBA shares is NOT correct? Assume that the past historical average return is the true population average of future expected returns.
Question 850 gross domestic product, gross domestic product per capita
Below is a table showing some countries’ GDP, population and GDP per capita.
| Countries' GDP and Population | |||
| GDP | Population | GDP per capita | |
| USD million | millions of people | USD | |
| United States | 18,036,648 | 325 | 55,492 |
| China | 11,158,457 | 1,383 | 8,066 |
| Japan | 4,383,076 | 127 | 34,586 |
| Germany | 3,363,600 | 83 | 40,623 |
| Norway | 500,519 | 5 | 95,027 |
Source: "GDP and its breakdown at current prices in US Dollars" United Nations Statistics Division. December 2016.
Using this data only, which one of these countries’ citizens have the highest living standards?
Question 888 foreign exchange rate, speculation, no explanation
The current Australian exchange rate is 0.8 USD per AUD.
If you think that the AUD will depreciate against the USD, contrary to the rest of the market, how could you profit? Right now you should:
Question 889 cross currency interest rate parity, no explanation
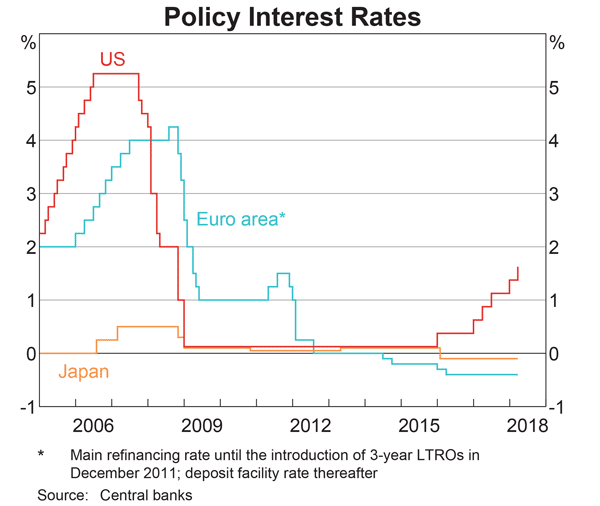
Judging by the graph, in 2018 the USD short term interest rate set by the US Federal Reserve is higher than the JPY short term interest rate set by the Bank of Japan, which is higher than the EUR short term interest rate set by the European central bank.

At the latest date shown in 2018: ##r_{USD}>r_{JPY}>r_{EUR}##
Assume that each currency’s yield curve is flat at the latest date shown in 2018, so interest rates are expected to remain at their current level into the future.
Which of the following statements is NOT correct?
Over time you would expect the: