A firm changes its capital structure by issuing a large amount of debt and using the funds to repurchase shares. Its assets are unchanged. Ignore interest tax shields.
According to the Capital Asset Pricing Model (CAPM), which statement is correct?
Question 308 risk, standard deviation, variance, no explanation
A stock's standard deviation of returns is expected to be:
- 0.09 per month for the first 5 months;
- 0.14 per month for the next 7 months.
What is the expected standard deviation of the stock per year ##(\sigma_\text{annual})##?
Assume that returns are independently and identically distributed (iid) and therefore have zero auto-correlation.
The following equation is the Dividend Discount Model, also known as the 'Gordon Growth Model' or the 'Perpetuity with growth' equation.
### p_0= \frac{c_1}{r-g} ###
Which expression is equal to the expected dividend return?
Find Sidebar Corporation's Cash Flow From Assets (CFFA), also known as Free Cash Flow to the Firm (FCFF), over the year ending 30th June 2013.
| Sidebar Corp | ||
| Income Statement for | ||
| year ending 30th June 2013 | ||
| $m | ||
| Sales | 405 | |
| COGS | 100 | |
| Depreciation | 34 | |
| Rent expense | 22 | |
| Interest expense | 39 | |
| Taxable Income | 210 | |
| Taxes at 30% | 63 | |
| Net income | 147 | |
| Sidebar Corp | ||
| Balance Sheet | ||
| as at 30th June | 2013 | 2012 |
| $m | $m | |
| Cash | 0 | 0 |
| Inventory | 70 | 50 |
| Trade debtors | 11 | 16 |
| Rent paid in advance | 4 | 3 |
| PPE | 700 | 680 |
| Total assets | 785 | 749 |
| Trade creditors | 11 | 19 |
| Bond liabilities | 400 | 390 |
| Contributed equity | 220 | 220 |
| Retained profits | 154 | 120 |
| Total L and OE | 785 | 749 |
Note: All figures are given in millions of dollars ($m).
The cash flow from assets was:
The below screenshot of Commonwealth Bank of Australia's (CBA) details were taken from the Google Finance website on 7 Nov 2014. Some information has been deliberately blanked out.
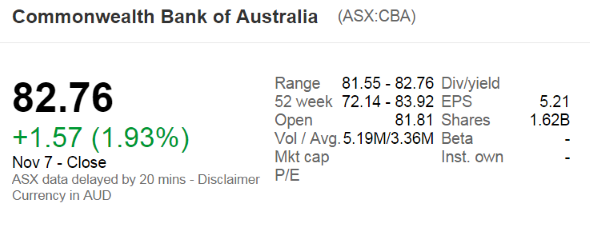
What was CBA's approximate payout ratio over the 2014 financial year?
Note that the firm's interim and final dividends were $1.83 and $2.18 respectively over the 2014 financial year.
The below screenshot of Microsoft's (MSFT) details were taken from the Google Finance website on 28 Nov 2014. Some information has been deliberately blanked out.
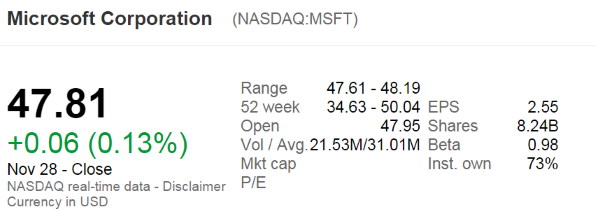
What was MSFT's approximate payout ratio over the last year?
Note that MSFT's past four quarterly dividends were $0.31, $0.28, $0.28 and $0.28.
Question 606 foreign exchange rate, American and European terms
Which of the following FX quotes (current in October 2015) is given in American terms?
Question 624 franking credit, personal tax on dividends, imputation tax system, no explanation
Which of the following statements about Australian franking credits is NOT correct? Franking credits:
Question 779 mean and median returns, return distribution, arithmetic and geometric averages, continuously compounding rate
Fred owns some BHP shares. He has calculated BHP’s monthly returns for each month in the past 30 years using this formula:
###r_\text{t monthly}=\ln \left( \dfrac{P_t}{P_{t-1}} \right)###He then took the arithmetic average and found it to be 0.8% per month using this formula:
###\bar{r}_\text{monthly}= \dfrac{ \displaystyle\sum\limits_{t=1}^T{\left( r_\text{t monthly} \right)} }{T} =0.008=0.8\% \text{ per month}###He also found the standard deviation of these monthly returns which was 15% per month:
###\sigma_\text{monthly} = \dfrac{ \displaystyle\sum\limits_{t=1}^T{\left( \left( r_\text{t monthly} - \bar{r}_\text{monthly} \right)^2 \right)} }{T} =0.15=15\%\text{ per month}###Assume that the past historical average return is the true population average of future expected returns and the stock's returns calculated above ##(r_\text{t monthly})## are normally distributed. Which of the below statements about Fred’s BHP shares is NOT correct?