A stock has a beta of 0.5. Its next dividend is expected to be $3, paid one year from now. Dividends are expected to be paid annually and grow by 2% pa forever. Treasury bonds yield 5% pa and the market portfolio's expected return is 10% pa. All returns are effective annual rates.
What is the price of the stock now?
A stock has a beta of 1.2. Its next dividend is expected to be $20, paid one year from now.
Dividends are expected to be paid annually and grow by 1.5% pa forever.
Treasury bonds yield 3% pa and the market portfolio's expected return is 7% pa. All returns are effective annual rates.
What is the price of the stock now?
A stock has a beta of 1.5. The market's expected total return is 10% pa and the risk free rate is 5% pa, both given as effective annual rates.
What do you think will be the stock's expected return over the next year, given as an effective annual rate?
A stock has a beta of 1.5. The market's expected total return is 10% pa and the risk free rate is 5% pa, both given as effective annual rates.
In the last 5 minutes, bad economic news was released showing a higher chance of recession. Over this time the share market fell by 1%. The risk free rate was unchanged.
What do you think was the stock's historical return over the last 5 minutes, given as an effective 5 minute rate?
A stock has a beta of 1.5. The market's expected total return is 10% pa and the risk free rate is 5% pa, both given as effective annual rates.
Over the last year, bad economic news was released showing a higher chance of recession. Over this time the share market fell by 1%. So ##r_{m} = (P_{0} - P_{-1})/P_{-1} = -0.01##, where the current time is zero and one year ago is time -1. The risk free rate was unchanged.
What do you think was the stock's historical return over the last year, given as an effective annual rate?
The market's expected total return is 10% pa and the risk free rate is 5% pa, both given as effective annual rates.
A stock has a beta of 0.7.
What do you think will be the stock's expected return over the next year, given as an effective annual rate?
The market's expected total return is 10% pa and the risk free rate is 5% pa, both given as effective annual rates.
A stock has a beta of 0.7.
In the last 5 minutes, bad economic news was released showing a higher chance of recession. Over this time the share market fell by 2%. The risk free rate was unchanged. What do you think was the stock's historical return over the last 5 minutes, given as an effective 5 minute rate?
A firm changes its capital structure by issuing a large amount of equity and using the funds to repay debt. Its assets are unchanged. Ignore interest tax shields.
According to the Capital Asset Pricing Model (CAPM), which statement is correct?
Question 244 CAPM, SML, NPV, risk
Examine the following graph which shows stocks' betas ##(\beta)## and expected returns ##(\mu)##:
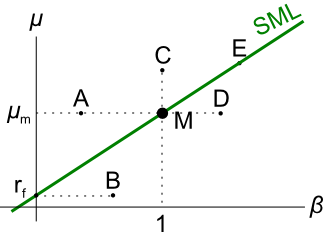
Assume that the CAPM holds and that future expectations of stocks' returns and betas are correctly measured. Which statement is NOT correct?
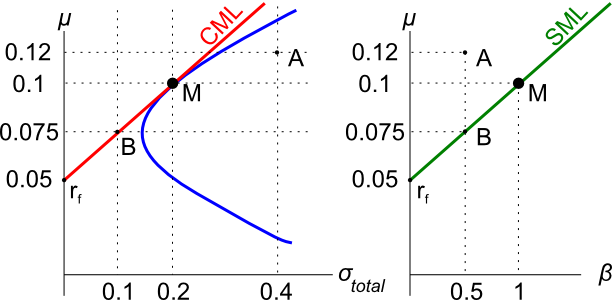
Assets A, B, M and ##r_f## are shown on the graphs above. Asset M is the market portfolio and ##r_f## is the risk free yield on government bonds. Assume that investors can borrow and lend at the risk free rate. Which of the below statements is NOT correct?
Question 657 systematic and idiosyncratic risk, CAPM, no explanation
A stock's required total return will decrease when its:
Question 778 CML, systematic and idiosyncratic risk, portfolio risk, CAPM
The capital market line (CML) is shown in the graph below. The total standard deviation is denoted by σ and the expected return is μ. Assume that markets are efficient so all assets are fairly priced.
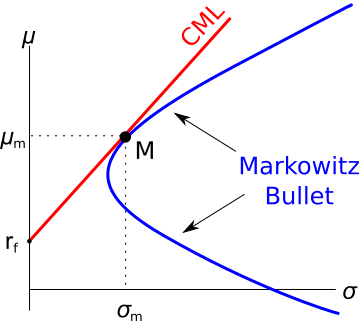
Which of the below statements is NOT correct?
Question 807 market efficiency, expected and historical returns, CAPM, beta, systematic risk, no explanation
You work in Asia and just woke up. It looked like a nice day but then you read the news and found out that last night the American share market fell by 10% while you were asleep due to surprisingly poor macro-economic world news. You own a portfolio of liquid stocks listed in Asia with a beta of 1.6. When the Asian equity markets open, what do you expect to happen to your share portfolio? Assume that the capital asset pricing model (CAPM) is correct and that the market portfolio contains all shares in the world, of which American shares are a big part. Your portfolio beta is measured against this world market portfolio.
When the Asian equity market opens for trade, you would expect your portfolio value to:
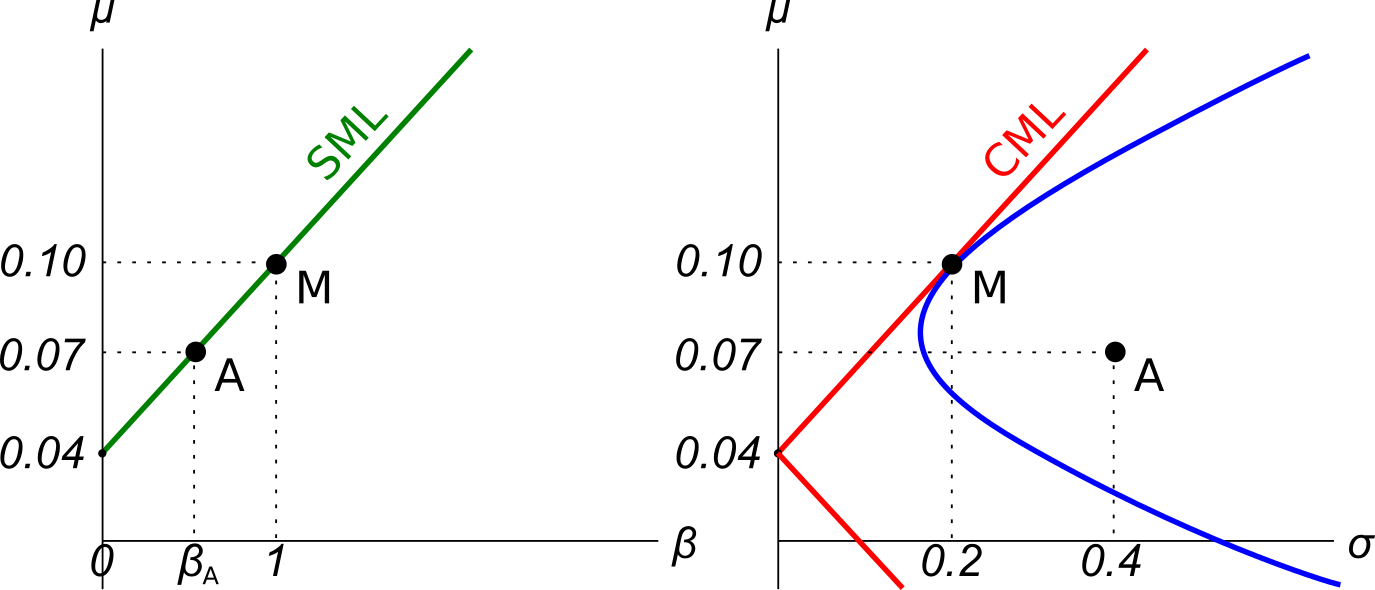
Question 809 Markowitz portfolio theory, CAPM, Jensens alpha, CML, systematic and idiosyncratic risk
A graph of assets’ expected returns ##(\mu)## versus standard deviations ##(\sigma)## is given in the graph below. The CML is the capital market line.
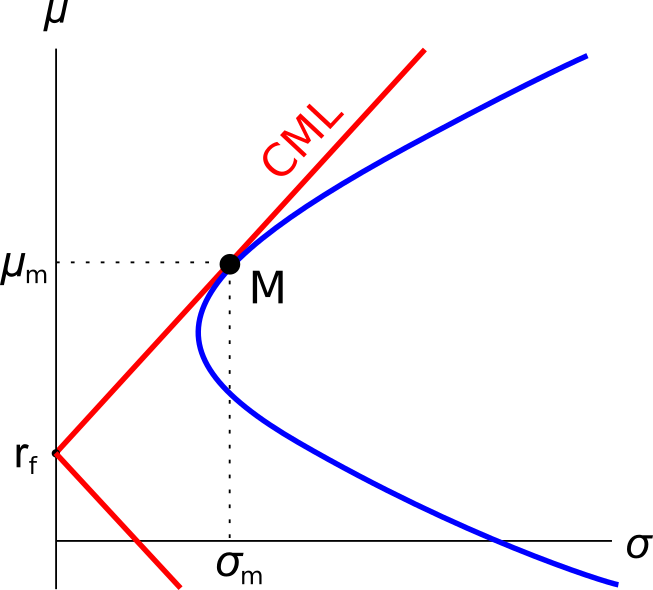
Which of the following statements about this graph, Markowitz portfolio theory and the Capital Asset Pricing Model (CAPM) theory is NOT correct?
Question 810 CAPM, systematic and idiosyncratic risk, market efficiency
Examine the graphs below. Assume that asset A is a single stock. Which of the following statements is NOT correct? Asset A:
A common phrase heard in financial markets is that ‘high risk investments deserve high returns’. To make this statement consistent with the Capital Asset Pricing Model (CAPM), a high amount of what specific type of risk deserves a high return?
Investors deserve high returns when they buy assets with high:
Question 988 variance, covariance, beta, CAPM, risk, no explanation
| Price Data Time Series | |||||||||||
| Sourced from Yahoo Finance Historical Price Data | |||||||||||
| Date | S&P500 Index (^GSPC) | Apple (AAPL) | |||||||||
| Open | High | Low | Close | Adj close | Open | High | Low | Close | Adj close | ||
| 2007, Wed 3 Jan | 1418 | 1429 | 1408 | 1417 | 1417 | 12.33 | 12.37 | 11.7 | 11.97 | 10.42 | |
| 2008, Wed 2 Jan | 1468 | 1472 | 1442 | 1447 | 1447 | 28.47 | 28.61 | 27.51 | 27.83 | 24.22 | |
| 2009, Fri 2 Jan | 903 | 935 | 899 | 932 | 932 | 12.27 | 13.01 | 12.17 | 12.96 | 11.28 | |
| 2010, Mon 4 Jan | 1117 | 1134 | 1117 | 1133 | 1133 | 30.49 | 30.64 | 30.34 | 30.57 | 26.6 | |
| Source: Yahoo Finance. | |||||||||||
Which of the following statements about the above table which is used to calculate Apple's equity beta is NOT correct?