Calculate Australia’s GDP over the 2016 calendar year using the below table:
| Australian Gross Domestic Product Components | ||||
| A$ billion, 2016 Calendar Year from 1 Jan 2016 to 31 Dec 2016 inclusive | ||||
| Consumption | Investment | Government spending | Exports | Imports |
| 971 | 421 | 320 | 328 | 344 |
Source: ABS 5206.0 Australian National Accounts: National Income, Expenditure and Product. Table 3. Expenditure on Gross Domestic Product (GDP), Current prices.
Over the 2016 calendar year, Australia’s GDP was:
Question 841 gross domestic product, government spending
The government spends money on:
- Goods and services such as defence, police, schools, hospitals and roads; and
- Transfer payments (also called welfare) such as the pension, dole, disability support and student support.
When calculating GDP (=C+I+G+X-M), the ‘government spending’ component (G) is supposed to include:
Question 850 gross domestic product, gross domestic product per capita
Below is a table showing some countries’ GDP, population and GDP per capita.
| Countries' GDP and Population | |||
| GDP | Population | GDP per capita | |
| USD million | millions of people | USD | |
| United States | 18,036,648 | 325 | 55,492 |
| China | 11,158,457 | 1,383 | 8,066 |
| Japan | 4,383,076 | 127 | 34,586 |
| Germany | 3,363,600 | 83 | 40,623 |
| Norway | 500,519 | 5 | 95,027 |
Source: "GDP and its breakdown at current prices in US Dollars" United Nations Statistics Division. December 2016.
Using this data only, which one of these countries’ citizens have the highest living standards?
Which form of production is included in the Gross Domestic Product (GDP) reported by the government statistics agency?
What effect is being referred to in the following quote from the MARTIN model description?
Economy-wide models also account for feedback between economic variables. For example, an increase in aggregate demand will encourage firms to hire more workers, which raises employment and lowers the unemployment rate. The tightening of the labour market is likely to lead to an increase in wages growth. The resulting increase in household incomes is likely to lead to an increase in consumption, further raising aggregate demand. (Ballantyne et al, 2019)
The name of the effect being referred to is:
Question 1039 gross domestic product, inflation, business cycle
In this business cycle graph shown in the RBA's article explaining recessions, how might 'output' on the y-axis be measured?
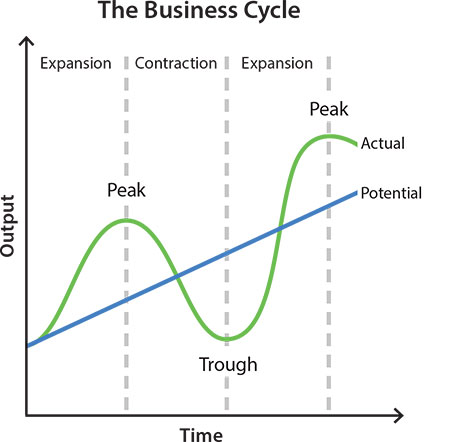
The ‘output’ y-axis amount in the business cycle chart can be measured by: