A common phrase heard in financial markets is that ‘high risk investments deserve high returns’. To make this statement consistent with the Capital Asset Pricing Model (CAPM), a high amount of what specific type of risk deserves a high return?
Investors deserve high returns when they buy assets with high:
According to the CAPM, high systematic risk investments deserve high returns. This is because systematic risk is the only risk that can't be diversified away, it affects all systematically risky assets at the same time. Therefore it's the more frightening risk for investors and those who are willing to put up with it deserve higher total returns.
Note that systematic risk is also known as market risk or un-diversifiable risk.
Beta ##(\beta)## measures systematic risk. The higher the beta, the higher the required total return. This is reflected in the CAPM's security market line (SML) formula:
###r_i = r_f + \beta_i (r_m - r_f) ###A stock has a beta of 1.2. Its next dividend is expected to be $20, paid one year from now.
Dividends are expected to be paid annually and grow by 1.5% pa forever.
Treasury bonds yield 3% pa and the market portfolio's expected return is 7% pa. All returns are effective annual rates.
What is the price of the stock now?
Starting with the CAPM's SML equation we can find the required return from the stock's beta, the market return and the risk free rate:
###\begin{aligned} \mu_E &= r_f + \beta_E(\mu_m-r_f) \\ &= 0.03 + 1.2(0.07-0.03) \\ &= 0.078 \\ \end{aligned} ###
Now that we have the required return on equity we can discount the dividends on equity using the perpetuity with growth formula, also known as the Gordon growth model.
###\begin{aligned} P_0 =& \frac{C_1}{\mu_{E} - g} \\ =& \frac{20}{0.078-0.015} \\ =& 317.46031746 \end{aligned}###A stock has a beta of 1.5. The market's expected total return is 10% pa and the risk free rate is 5% pa, both given as effective annual rates.
What do you think will be the stock's expected return over the next year, given as an effective annual rate?
A stock has a beta of 1.5. The market's expected total return is 10% pa and the risk free rate is 5% pa, both given as effective annual rates.
In the last 5 minutes, bad economic news was released showing a higher chance of recession. Over this time the share market fell by 1%. The risk free rate was unchanged.
What do you think was the stock's historical return over the last 5 minutes, given as an effective 5 minute rate?
Over the last 5 minutes, the return on the risk free rate would be close to zero ##(r_{f\text{ 5 min}} \approx 0)## since it's only 5% per year. The historical market return ##(r_{m\text{ 5 min}})## over the last 5 minutes was -1%. Note that in the CAPM equation below all returns are effective 5 minute historical returns. Substituting this into the CAPM equation: ###\begin{aligned} r_{i\text{ 5 min}} &= r_{f\text{ 5 min}} + \beta_i(r_{m\text{ 5 min}}-r_{f\text{ 5 min}}) \\ &= 0 + 1.5 \times (-0.01-0) \\ &= -0.015 \\ \end{aligned} ###
Discussion of why the 5 minute risk free rate is close to zero
To find the exact 5 minute risk free rate and show that it is truly close to zero, let's convert this 5% effective annual risk free rate into an effective 5 minute risk free rate. Assume that there are 365 days per year, 24 hours per day, 60 minutes per hour and therefore 12 (=60/5) five minute periods per hour.
###(1+r_{f\text{ 5 min}})^\text{number of 5 min periods in a year} = (1+r_{f\text{ annual}})^1### ###(1+r_{f\text{ 5 min}})^{365 \times 24 \times 60 / 5} = (1+r_{f\text{ annual}})### ###\begin{aligned} r_{f\text{ 5 min}} &= (1+r_{f\text{ annual}})^{1/(365 \times 24 \times 60 / 5)}-1 \\ &= (1+0.05)^{1/(365 \times 24 \times 60 / 5)}-1 \\ &= 0.000000464137895 \text{ pa} \\ &= 0.0000464137895 \text{% pa} \\ &\approx 0\text{% pa} \end{aligned}###A stock has a beta of 1.5. The market's expected total return is 10% pa and the risk free rate is 5% pa, both given as effective annual rates.
Over the last year, bad economic news was released showing a higher chance of recession. Over this time the share market fell by 1%. So ##r_{m} = (P_{0} - P_{-1})/P_{-1} = -0.01##, where the current time is zero and one year ago is time -1. The risk free rate was unchanged.
What do you think was the stock's historical return over the last year, given as an effective annual rate?
Over the last year, the historical effective return on the risk free rate was 5% ##(r_f = 0.05)##. The historical market return ##(r_m)## over the last year was -1% ##(r_m = -0.01)##. Note that in the CAPM equation below all returns are effective annual historical returns. Substituting this into the CAPM equation: ###\begin{aligned} r_i &= r_f + \beta_i(r_m-r_f) \\ &= 0.05 + 1.5 \times (-0.01-0.05) \\ &= -0.04 \\ \end{aligned} ###
Question 776 market efficiency, systematic and idiosyncratic risk, beta, income and capital returns
Which of the following statements about returns is NOT correct? A stock's:
According to the CAPM, a stock's required total return depends on its systematic variance or beta. For some stock ##i##:
###r_\text{total i} = r_f + \beta_i (r_m - r_f)###A stock's total variance is the sum of the systematic and diversifiable variances. For some stock ##i##:
###\text{TotalVariance} = \text{SystematicVariance} + \text{DiversifiableVariance}### ###\begin{aligned} \sigma_\text{total i}^2 &= \sigma_\text{systematic i}^2 + \sigma_{\text{diversifiable i}}^2 \\ &= \beta_i^2\sigma_\text{m}^2 + \sigma_{\epsilon\text{ i}}^2 \\ \end{aligned}\\###Although the total return and total variance have the same title 'total', they are not closely related since total required returns depend on systematic variance only. This is because investors ignore diversifiable variance since it's easily reduced to zero by holding a variety of stocks.
The sum of the capital and dividend returns will equal the stock's total return.
###\begin{aligned} r_\text{total} &= r_\text{capital} + r_\text{dividend} \\ &= \dfrac{\text{Price}_\text{end} - \text{Price}_\text{start}}{\text{Price}_\text{start}} + \dfrac{\text{Dividend}_\text{end}}{\text{Price}_\text{start}} \\ \end{aligned}###The split between capital and dividend yields will depend on the company's payout policy. If the company chooses to:
- Not to pay any dividends and instead re-invests, the dividend yield will be zero and the capital yield will be high and equal to the total return.
- Pay out all of its cash flows as dividends, the dividend yield will be high and equal to the total return and the capital yield will be zero since there's no re-investment back into the company.
See Question 455 for a discussion of how dividend policy and re-investment affects capital returns.
The market's expected total return is 10% pa and the risk free rate is 5% pa, both given as effective annual rates.
A stock has a beta of 0.5.
In the last 5 minutes, the federal government unexpectedly raised taxes. Over this time the share market fell by 3%. The risk free rate was unchanged.
What do you think was the stock's historical return over the last 5 minutes, given as an effective 5 minute rate?
Over the last 5 minutes, the return on the risk free rate would be close to zero ##(r_{f\text{ 5 min}} \approx 0)## since it's only 5% per year. The historical market return ##(r_{m\text{ 5 min}})## over the last 5 minutes was -3%. Note that in the CAPM equation below all returns are effective 5 minute historical returns. Substituting this into the CAPM equation: ###\begin{aligned} r_{i\text{ 5 min}} &= r_{f\text{ 5 min}} + \beta_i(r_{m\text{ 5 min}}-r_{f\text{ 5 min}}) \\ &= 0 + 0.5 \times (-0.03-0) \\ &= -0.015 \\ \end{aligned} ###
Discussion of why the 5 minute risk free rate is close to zero
To find the exact 5 minute risk free rate and show that it is truly close to zero, let's convert this 5% effective annual risk free rate into an effective 5 minute risk free rate. Assume that there are 365 days per year, 24 hours per day and 60 minutes per hour. Expressing a 5-minute period as a fraction of a year:
###\begin{aligned} \text{5 minutes } &= \frac{1}{365} \times \frac{1}{24} \times \frac{5}{60} \text{ years} \\ &= \frac{5}{365 \times 24 \times 60} \text{ years} \\ \end{aligned}### ###\begin{aligned} r_{f\text{ 5 min}} &= (1+r_{f\text{ annual}})^{5/(365 \times 24 \times 60)}-1 \\ &= (1+0.05)^{5/(365 \times 24 \times 60)}-1 \\ &= 0.000000278483 \text{ pa} \\ &= 0.0000278483 \text{% pa} \\ &\approx 0\text{% pa} \end{aligned}###Question 807 market efficiency, expected and historical returns, CAPM, beta, systematic risk, no explanation
You work in Asia and just woke up. It looked like a nice day but then you read the news and found out that last night the American share market fell by 10% while you were asleep due to surprisingly poor macro-economic world news. You own a portfolio of liquid stocks listed in Asia with a beta of 1.6. When the Asian equity markets open, what do you expect to happen to your share portfolio? Assume that the capital asset pricing model (CAPM) is correct and that the market portfolio contains all shares in the world, of which American shares are a big part. Your portfolio beta is measured against this world market portfolio.
When the Asian equity market opens for trade, you would expect your portfolio value to:
No explanation provided.
Stock A has a beta of 0.5 and stock B has a beta of 1. Which statement is NOT correct?
All statements are true except the last phrase in answer (c). The market has a beta of one by definition, and so does stock B. Therefore they have the same level of systematic risk.
But total risk is comprised of systematic and diversifiable risk. Let a stock be represented by 'i'. When risk is measured using variance, then the following equation breaks any stock i's total variance into its systematic and idiosyncratic variances:
###\begin{aligned} \sigma_\text{i, total}^2 &= \beta_i^2.\sigma_m^2 + \sigma_\text{i, diversifiable}^2 \\ &= \sigma_\text{i, systematic}^2 + \sigma_\text{i, diversifiable}^2 \\ \end{aligned} ###
The market portfolio has no diversifiable variance since it is fully diversified. Stock B, on the other hand, is likely to have significant diversifiable variance since it is a single stock. Therefore stock B is likely to have higher total variance than the market portfolio since it has more diversifiable variance.
Which statement is the most correct?
According to the CAPM:
- beta is measured as:
###\begin{aligned} \beta_{i} &= \frac{\sigma_{i,m}}{\sigma_m^2} = \frac{cov(r_i, r_m)}{var(r_m)} \\ \end{aligned} ###
- total variance is the sum of systematic and idiosyncratic variances:
###\begin{aligned} \sigma_\text{i,total}^2 &= \beta_i^2.\sigma_m^2 + \sigma_\text{i,diversifiable}^2 \\ &= \sigma_\text{i,systematic}^2 + \sigma_\text{i,diversifiable}^2 \\ \end{aligned} ###
The risk free rate ##r_f## does not vary, it is a constant, therefore it has zero systematic and idiosyncratic variance and its beta is zero:
###\begin{aligned} \beta_{f} &= \frac{\sigma_{f,m}}{\sigma_m^2} = \frac{0}{\sigma_m^2} = 0 \\ \end{aligned} ###
The market portfolio is a portfolio of risky assets so it has a variance, but by definition its beta is one since the covariance of an asset with itself is equal to its variance:
###\begin{aligned} \beta_{m} &= \frac{\sigma_{m,m}}{\sigma_m^2} = \frac{\sigma_m^2}{\sigma_m^2} = 1 \\ \end{aligned} ###
The market portfolio has no idiosyncratic variance because it is fully diversified, and this makes sense since, using the total variance equation:
###\begin{aligned} \sigma_\text{i,total}^2 &= \beta_i^2.\sigma_\text{m,total}^2 + \sigma_\text{i,diversifiable}^2 \\ \sigma_\text{m,total}^2 &= \beta_m^2.\sigma_\text{m,total}^2 + \sigma_\text{m, diversifiable}^2 \\ &= 1^2.\sigma_\text{m,total}^2 + \sigma_\text{m,diversifiable}^2 \\ &= \sigma_\text{m,total}^2 + \sigma_\text{m,diversifiable}^2 \\ \sigma_\text{m,diversifiable}^2 &= \sigma_\text{m,total}^2 - \sigma_\text{m,total}^2 \\ &= 0 \\ \end{aligned} ###
Therefore the risk free rate has no risk at all so it has zero systematic and diversifiable (or idiosyncratic) risk, and the market portfolio has zero idiosyncratic risk.
Diversification is achieved by investing in a large amount of stocks. What type of risk is reduced by diversification?
Other names for diversifiable risk include:
- idiosyncratic risk
- firm-specific risk
- unique risk
- residual risk
- non-market risk
- non-systematic risk
Other names for systematic risk include:
- market risk
- undiversifiable risk
- beta risk
According to the CAPM, total risk is comprised of systematic and diversifiable risk. Mathematically, for some asset 'i':
###\text{total variance} = \text{systematic variance} + \text{idiosyncratic variance}### ###\begin{aligned} \sigma_\text{total, i}^2 &= \sigma_\text{systematic, i}^2 + \sigma_{\text{idiosyncratic, i}}^2 \\ &= \beta_i^2\sigma_\text{m}^2 + \sigma_{\epsilon\text{, i}}^2 \\ \end{aligned}\\###Idiosyncratic risk can be reduced by diversification but systematic risk can not.
According to the theory of the Capital Asset Pricing Model (CAPM), total variance can be broken into two components, systematic variance and idiosyncratic variance. Which of the following events would be considered the most diversifiable according to the theory of the CAPM?
Diversifiable events affect only a specific company or industry or area, such as a firm's poor earnings announcement. Systematic events affect a whole country or the world and can't be avoided.
A firm changes its capital structure by issuing a large amount of debt and using the funds to repurchase shares. Its assets are unchanged. Ignore interest tax shields.
According to the Capital Asset Pricing Model (CAPM), which statement is correct?
Beta (##\beta##) is a measure of systematic risk.
Since the value of the firm's assets must equal the value of its debt and equity,###V=D+E### The firm's assets' beta must equal the weighted average beta of the debt and equity, so: ###\beta_V = \frac{D}{V}\beta_D + \frac{E}{V}\beta_E###
In this question, there is no change in the firm's assets. Therefore, all things remaining equal, there shouldn't be any change in the beta of the firm's assets (##\beta_V##).
Since the firm is issuing more debt by borrowing in the form of a loan or a bond, the amount of debt will increase (↑ D). The funds raised from the debt are being used to repurchase equity, so the amount of equity will decrease (↓ E).
Equity holders have a residual claim on the firm's assets, which means that they get paid last if the firm goes bankrupt. So shareholders get paid after debt holders. Therefore the increase in the amount of debt means that the equity holders are less likely to receive any money if the firm goes bankrupt. It also means that there will be a larger amount of interest payments that the firm must meet so there is a higher chance of going bankrupt. This means that equity must have more systematic risk, so it's beta will increase (↑##\beta_E##). This is the answer.
Also note that since there are more debt-holders, the larger amount of debt also has more systematic risk (↑##\beta_D##). This may appear impossible since how can the beta on debt and equity rise, while the beta on assets remain constant? But this is possible since the beta on debt is always less than the beta on equity (##\beta_D < \beta_E##), and while both betas rise, there is a larger weight on debt (↑##\frac{D}{V}##), and a lower weight on equity (↓##\frac{E}{V}##), so the asset beta stays the same.
To summarise: ###\begin{matrix} \cdot \\ \beta_V \\ \end{matrix} \begin{matrix} \phantom{1} \\ = \\ \end{matrix} \begin{matrix} \uparrow \\ \frac{D}{V} \\ \end{matrix} \begin{matrix} \uparrow \\ \beta_D \\ \end{matrix} \begin{matrix} \phantom{1} \\ + \\ \end{matrix} \begin{matrix} \downarrow \\ \frac{E}{V} \\ \end{matrix} \begin{matrix} \uparrow \\ \beta_E \\ \end{matrix}###
Question 104 CAPM, payout policy, capital structure, Miller and Modigliani, risk
Assume that there exists a perfect world with no transaction costs, no asymmetric information, no taxes, no agency costs, equal borrowing rates for corporations and individual investors, the ability to short the risk free asset, semi-strong form efficient markets, the CAPM holds, investors are rational and risk-averse and there are no other market frictions.
For a firm operating in this perfect world, which statement(s) are correct?
(i) When a firm changes its capital structure and/or payout policy, share holders' wealth is unaffected.
(ii) When the idiosyncratic risk of a firm's assets increases, share holders do not expect higher returns.
(iii) When the systematic risk of a firm's assets increases, share holders do not expect higher returns.
Select the most correct response:
Statement (i) is true according to Miller and Modigliani's theories of capital structure and payout policy irrelevance.
Statement (ii) is true according to the CAPM because idiosyncratic risk is irrelevant since it can be diversified away when combined with a large portfolio of assets.
Statement (iii) is false according to the CAPM. Non-diversifiable systematic risk is rewarded with a higher return. This is the basis of the CAPM SML equation, expected return increases with beta:
###\begin{aligned} \mu_i &= r_f + \beta_i(\mu_m-r_f) \\ \end{aligned} ###
According to the theory of the Capital Asset Pricing Model (CAPM), total risk can be broken into two components, systematic risk and idiosyncratic risk. Which of the following events would be considered a systematic, undiversifiable event according to the theory of the CAPM?
Systematic events affect a whole country and can't be avoided, such as an increase in a country's corporate tax rates. Diversifiable events affect only a specific company or industry or area, such as a firm's poor earnings announcement.
A firm changes its capital structure by issuing a large amount of equity and using the funds to repay debt. Its assets are unchanged. Ignore interest tax shields.
According to the Capital Asset Pricing Model (CAPM), which statement is correct?
Beta (##\beta##) is a measure of systematic risk, along with variance (##\sigma^2##) and standard deviation (##\sigma##) .
Since the firm's assets (V) are funded by debt (D) and equity (E), the systematic risk of the firm's assets equals the weighted average beta of the debt and equity, so: ###\beta_V = \frac{D}{V}\beta_D + \frac{E}{V}\beta_E###
In this question, there is no change in the firm's assets. Therefore, all things remaining equal, there shouldn't be any change in the beta of the firm's assets (##\beta_V##).
Since the firm is issuing more equity (using a rights issue or private placement for example) and using the funds to repay debt (paying back the bond or loan-holders), the amount of equity will increase (↑ E) and the amount of debt will decrease (↓ D).
Equity holders have a residual claim on the firm's assets, which means that they get paid last if the firm goes bankrupt. So shareholders get paid after debt holders. Therefore the decrease in the amount of debt means that the equity holders are more likely to receive some payment if the firm goes bankrupt. It also means that there will be a smaller amount of interest payments that the firm must meet so there is a lower chance of going bankrupt. This means that equity must have less systematic risk, so it's beta will fall (↓##\beta_E##). This is the answer.
Also note that since there are less debt-holders, the smaller amount of debt also has less systematic risk (↓##\beta_D##). This may appear impossible since how can the beta on debt and equity fall, while the beta on assets remain constant? But this is possible since the beta on debt is always less than the beta on equity (##\beta_D < \beta_E##), and while both betas fall, there is a lower weight on debt (↓##\frac{D}{V}##), and a higher weight on equity (↑##\frac{E}{V}##), so the beta on assets stays the same.
To summarise: ###\overbrace{\beta_V}^{\cdot} = \overbrace{\frac{D}{V}}^{\downarrow} \overbrace{\beta_D}^{\downarrow} + \overbrace{\frac{E}{V}}^{\uparrow} \overbrace{\beta_E}^{\downarrow} ###
Question 244 CAPM, SML, NPV, risk
Examine the following graph which shows stocks' betas ##(\beta)## and expected returns ##(\mu)##:
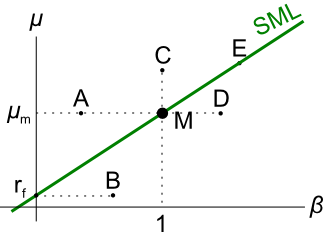
Assume that the CAPM holds and that future expectations of stocks' returns and betas are correctly measured. Which statement is NOT correct?
This question is related to the security market line (SML) in the capital asset pricing model (CAPM). Stocks that plot:
- Above the SML have a positive alpha (or positive abnormal return), are under-priced, and buying them is a positive NPV investment.
Assets A and C are in this category. - On the SML have a zero alpha (or zero abnormal return), are fairly-priced, and buying them is a zero NPV investment.
Assets E, M and ##r_f## are in this category. - Below the SML have a negative alpha (or negative abnormal return), are over-priced, and buying them is a negative NPV investment.
Assets B and D are in this category.
Therefore, answer choices (a), (b), (c) and (e) are all correct.
But answer (d) is not correct since stock D has a higher beta (##\beta##) than the market portfolio (M) since it plots further to the right. Because beta is a measure of systematic risk, stock D must have more systematic risk than the market portfolio, not less.
The security market line (SML) shows the relationship between beta and expected return.
Buying investment projects that plot above the SML would lead to:
Investment assets that plot above the SML are:
- Expected to over-perform, having a positive abnormal return or 'alpha';
- Under-priced, the price is cheap;
- Positive NPV decisions when bought by buyers, and negative NPV decisions when sold by sellers.
Note that the SML relates beta (a measure of systematic risk) to expected return, so it only accounts for systematic risk and can not be used to gauge diversifiable risk or total risk.
Question 235 SML, NPV, CAPM, risk
The security market line (SML) shows the relationship between beta and expected return.
Investment projects that plot on the SML would have:
Investment assets that plot on the SML are:
- Expected to neither over- or under-perform, having a zero abnormal return or 'alpha';
- Fairly priced, since the price is fair for the buyer and the seller;
- Zero NPV decisions when bought or sold.
Note that the SML relates beta (a measure of systematic risk) to expected return, so it only accounts for systematic risk and can not be used to gauge diversifiable risk or total risk.
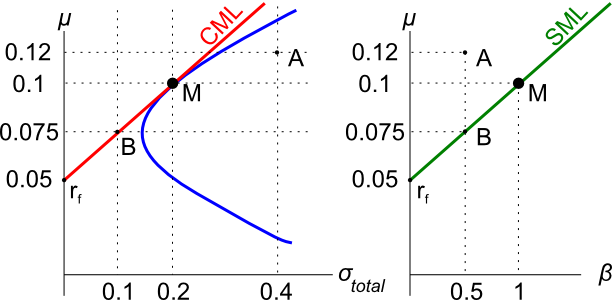
Assets A, B, M and ##r_f## are shown on the graphs above. Asset M is the market portfolio and ##r_f## is the risk free yield on government bonds. Which of the below statements is NOT correct?
The net present value (NPV) of buying asset A would be positive since it plots above the security market line (SML), it has a positive Jensen's alpha, because it is under-priced.
The net present value (NPV) of buying asset B would be zero since it plots on the security market line (SML), it has a zero Jensen's alpha, because it is fairly priced.
The total return of any asset can be broken down in different ways. One possible way is to use the dividend discount model (or Gordon growth model):
###p_0 = \frac{c_1}{r_\text{total}-r_\text{capital}}###
Which, since ##c_1/p_0## is the income return (##r_\text{income}##), can be expressed as:
###r_\text{total}=r_\text{income}+r_\text{capital}###
So the total return of an asset is the income component plus the capital or price growth component.
Another way to break up total return is to use the Capital Asset Pricing Model:
###r_\text{total}=r_\text{f}+β(r_\text{m}- r_\text{f})###
###r_\text{total}=r_\text{time value}+r_\text{risk premium}###
So the risk free rate is the time value of money and the term ##β(r_\text{m}- r_\text{f})## is the compensation for taking on systematic risk.
Using the above theory and your general knowledge, which of the below equations, if any, are correct?
(I) ##r_\text{income}=r_\text{time value}##
(II) ##r_\text{income}=r_\text{risk premium}##
(III) ##r_\text{capital}=r_\text{time value}##
(IV) ##r_\text{capital}=r_\text{risk premium}##
(V) ##r_\text{income}+r_\text{capital}=r_\text{time value}+r_\text{risk premium}##
Which of the equations are correct?
The only correct statement is that the Gordon growth model (GGM) and capital asset pricing model (CAPM) both give an asset's total required return:
###r_\text{total, GGM} = r_\text{total, CAPM} ### ###\frac{c_1}{p_0}+r_\text{capital} = r_f + \beta(r_m - r_f) ### ###r_\text{income}+r_\text{capital} = r_\text{time value}+r_\text{risk premium} ###The income return in the GGM is unrelated to the time value of money (##r_f##) or the market risk premium (##\beta (r_m - r_f)##) in the CAPM. This is mainly because the income cash flow from an asset is often discretionary, such as:
- Dividends on shares which are decided by the company's board of directors.
- Coupon payments on fixed-coupon debt which are often set equal to the yield when the bond is first issued (so it's issued at par), but after that as the yield (which is the total return of debt) goes up or down, the coupon stays the same since it's fixed.
Both of these are examples of how the income return component of total returns is often quite arbitrary and unrelated to the risk free rate or market risk premium in the CAPM. Therefore, the capital return is also unrelated to either the time value of money or market risk premium too.
On the other hand, it could be argued that the floating coupon income return on a floating rate bond are closely related to the risk free rate.
Question 408 leverage, portfolio beta, portfolio risk, real estate, CAPM
You just bought a house worth $1,000,000. You financed it with an $800,000 mortgage loan and a deposit of $200,000.
You estimate that:
- The house has a beta of 1;
- The mortgage loan has a beta of 0.2.
What is the beta of the equity (the $200,000 deposit) that you have in your house?
Also, if the risk free rate is 5% pa and the market portfolio's return is 10% pa, what is the expected return on equity in your house? Ignore taxes, assume that all cash flows (interest payments and rent) were paid and received at the end of the year, and all rates are effective annual rates.
The house asset (V) is financed by the home loan debt (D) and the owners wealth or equity in the house (E).
###V = D + E###Owning all of the debt and equity is equivalent to owning the house asset. Therefore the house asset can be seen as a portfolio of debt and equity.
Method 1: Use the CAPM Portfolio beta equation to solve for the beta of equity
Applying the portfolio beta equation, the beta of the asset must equal the weighted average of the betas on debt and equity.
###\beta_\text{portfolio} = \beta_1.x_1 + \beta_2.x_2 + ... + \beta_n.x_n ### ###\begin{aligned} \beta_V &= \beta_D.x_D + \beta_E.x_E \\ &= \beta_D.\frac{D}{V} + \beta_E.\frac{E}{V} \\ 1 &= 0.2 \times \frac{800,000}{1,000,000} + \beta_E.\frac{200,000}{1,000,000} \\ \end{aligned} ### ### \beta_E = 4.2 ###Applying the CAPM,
###\begin{aligned} r_E &= r_f + \beta_E.(r_m - r_f) \\ &= 0.05 + 4.2 \times (0.1 - 0.05) \\ &= 0.26 \\ \end{aligned} ###It may seem surprising that the equity's beta and required total return is so high. The reason is because of leverage. The debt-to-assets ratio (D/V) is 80% and the debt-to-equity ratio (D/E) is 400%. If the value of the house asset rose by 1%, the value of equity would rise by 5%.
Method 2: Use the WACC equation to solve for the cost of equity
Find the required return on debt ##(r_D)## and assets ##(r_V)## using the CAPM:
###\begin{aligned} r_D &= r_f + \beta_D.(r_m - r_f) \\ &= 0.05 + 0.2 \times (0.1 - 0.05) \\ &= 0.06 \\ \end{aligned} ### ###\begin{aligned} r_V &= r_f + \beta_V.(r_m - r_f) \\ &= 0.05 + 1 \times (0.1 - 0.05) \\ &= 0.1 \\ \end{aligned} ###Using the weighted average cost of capital (WACC) equation (before tax since the question says ignore taxes), the cost of equity (also known as the required return on equity or opportunity cost of equity) can be found. ###\begin{aligned} r_V &= \text{WACC}_\text{before tax} \\ &= r_D.\dfrac{D}{V} + r_E.\dfrac{E}{V} \\ 0.1 &= 0.06 \times \dfrac{800,000}{1,000,000} + r_E \times \dfrac{200,000}{1,000,000} \\ \end{aligned} ### ###\begin{aligned} r_E &= \left(0.1 - 0.06 \times \dfrac{800,000}{1,000,000} \right) \times \dfrac{1,000,000}{200,000} \\ &= 0.26 \\ \end{aligned} ###
We can use the CAPM to find the beta of equity from this required return on equity:
###r_E = r_f + \beta_E.(r_m - r_f) ### ###0.26 = 0.05 + \beta_E.(0.1 - 0.05) ### ###\begin{aligned} \beta_E &= \dfrac{0.26 - 0.05}{0.1 - 0.05} \\ &= 4.2 \\ \end{aligned} ###The CAPM can be used to find a business's expected opportunity cost of capital:
###r_i=r_f+β_i (r_m-r_f)###
What should be used as the risk free rate ##r_f##?
Strictly, cash flows in one month should be matched with required returns over the next one month, and cash flows in 10 years should be matched with required returns over the next ten years. This means that the required total return (same as the opportunity cost of capital), and the risk free rate and market portfolio rate used to calculate the required return, should always match the timing of the cash flows.
But in practice, since using multiple discount rates is too cumbersome, most analysts simply assume that required returns don't change significantly over time. Analysts tend to use the longest term government bond yield available. This makes some sense since most businesses are a 'going concern', meaning that they are supposed to continue forever. Therefore the cash flows are expected to go forever so the required total return should be measured over a long period.
Note that the current long term government bond yield is more useful than the historical government bond yield since we're trying to find the present value of future cash flows, not past cash flows.
The choice of which government bond yield to use as the risk free rate is a hotly debated topic, as is the existence of a truly risk-free rate at all.
A stock's required total return will increase when its:
Total required returns only depend on systematic risk since that's the only risk that can't be diversified. Investors are afraid of systematic risk and deserve a higher expected return when exposed to this undiversifiable risk. This relationship is expressed mathematically in the security market line (SML) equation from the capital asset pricing model (CAPM). The total required return ##(r_\text{i, total})## of some asset ##i## is a function of its beta ##(\beta_i)##, which measures systematic risk.
###r_\text{i, total} = r_f + \beta_i(r_m - r_f)###
Assets A, B, M and ##r_f## are shown on the graphs above. Asset M is the market portfolio and ##r_f## is the risk free yield on government bonds. Assume that investors can borrow and lend at the risk free rate. Which of the below statements is NOT correct?
If risk-averse investors were forced to invest all of their wealth in a single risky asset A or B (not M since it's a portfolio) then they cannot diversify so total risk is important to them, not just systematic risk. Total risk is shown on the left graph's x-axis. Total variance equals systematic variance plus diversifiable variance:
###\text{TotalVariance} = \text{SystematicVariance} + \text{IdiosyncraticVariance}### ###\begin{aligned} \sigma_\text{total i}^2 &= \sigma_\text{systematic i}^2 + \sigma_{\text{idiosyncratic i}}^2 \\ &= \beta_i^2\sigma_\text{m}^2 + \sigma_{\epsilon\text{ i}}^2 \\ \end{aligned}\\###People who prefer low risk will choose asset B instead of A since ##\sigma_\text{B total} = 0.1## is less than ##\sigma_\text{B total}= 0.4##.
They're the sort of people who might carry an umbrella in their bag even when it's sunny, just in case it might rain. They suffer carrying it around but occasionally it helps them avoid getting drenched and sick. Or perhaps they purchase comprehensive car insurance. They're afraid of risk and are prepared to suffer low expected (average) returns to avoid large losses.
People who prefer high returns will choose asset A instead of B since ##\mu_A = 0.12## is greater than ##\mu_B = 0.075##.
They're the sort of people who may not purchase comprehensive car insurance because they're comfortable with the possibility of crashing their car and losing a large sum to replace it, if it means that they will have more money otherwise. They're comfortable with the possibility of suffering large losses if it means that on average they could gain more.
Choosing asset A or B is a personal choice, there's no correct answer. It depends on your return versus risk preferences. Of course in reality, you're not restricted to choose between A or B, you can choose a bit of both by making a portfolio which is the best idea.
Question 657 systematic and idiosyncratic risk, CAPM, no explanation
A stock's required total return will decrease when its:
No explanation provided.
The market's expected total return is 10% pa and the risk free rate is 5% pa, both given as effective annual rates.
A stock has a beta of 0.7.
What do you think will be the stock's expected return over the next year, given as an effective annual rate?
Using the capital asset pricing model's (CAPM) security market line (SML) formula:
###\begin{aligned} r_i &= r_f + \beta_i (r_m - r_f) \\ &= 0.05 + 0.7 (0.1 - 0.05) \\ &= 0.085 \\ &= 8.5 \text{% pa} \\ \end{aligned}###The market's expected total return is 10% pa and the risk free rate is 5% pa, both given as effective annual rates.
A stock has a beta of 0.7.
In the last 5 minutes, bad economic news was released showing a higher chance of recession. Over this time the share market fell by 2%. The risk free rate was unchanged. What do you think was the stock's historical return over the last 5 minutes, given as an effective 5 minute rate?
While the risk free rate is 5% per annum, over the last 5 minutes it would be close to zero since that's such a short time.
Using the capital asset pricing model's (CAPM) security market line (SML) formula based on these returns over the last 5 minutes, the stock's return (some stock ##i##) over the last 5 minutes is expected to be: ###\begin{aligned} r_{i \text{ 5min}} &= r_{f \text{ 5min}} + \beta_i (r_{m \text{ 5min}} - r_{f \text{ 5min}}) \\ &= 0 + 0.7 (-0.02 - 0) \\ &= -0.014 \\ &= -1.4 \text{% pa} \\ \end{aligned}###Question 988 variance, covariance, beta, CAPM, risk, no explanation
| Price Data Time Series | |||||||||||
| Sourced from Yahoo Finance Historical Price Data | |||||||||||
| Date | S&P500 Index (^GSPC) | Apple (AAPL) | |||||||||
| Open | High | Low | Close | Adj close | Open | High | Low | Close | Adj close | ||
| 2007, Wed 3 Jan | 1418 | 1429 | 1408 | 1417 | 1417 | 12.33 | 12.37 | 11.7 | 11.97 | 10.42 | |
| 2008, Wed 2 Jan | 1468 | 1472 | 1442 | 1447 | 1447 | 28.47 | 28.61 | 27.51 | 27.83 | 24.22 | |
| 2009, Fri 2 Jan | 903 | 935 | 899 | 932 | 932 | 12.27 | 13.01 | 12.17 | 12.96 | 11.28 | |
| 2010, Mon 4 Jan | 1117 | 1134 | 1117 | 1133 | 1133 | 30.49 | 30.64 | 30.34 | 30.57 | 26.6 | |
| Source: Yahoo Finance. | |||||||||||
Which of the following statements about the above table which is used to calculate Apple's equity beta is NOT correct?
The sample covariance of the effective total annual returns between the S&P500 and Apple is actually 0.298181591. This makes Apple's equity beta equal 3.530767 (=0.298181591/0.084452) which is quite a lot higher than the market's.