A share just paid its semi-annual dividend of $10. The dividend is expected to grow at 2% every 6 months forever. This 2% growth rate is an effective 6 month rate. Therefore the next dividend will be $10.20 in six months. The required return of the stock is 10% pa, given as an effective annual rate.
What is the price of the share now?
A stock is expected to pay the following dividends:
| Cash Flows of a Stock | ||||||
| Time (yrs) | 0 | 1 | 2 | 3 | 4 | ... |
| Dividend ($) | 2 | 2 | 2 | 10 | 3 | ... |
After year 4, the dividend will grow in perpetuity at 4% pa. The required return on the stock is 10% pa. Both the growth rate and required return are given as effective annual rates.
What will be the price of the stock in 5 years (t = 5), just after the dividend at that time has been paid?
Question 207 income and capital returns, bond pricing, coupon rate, no explanation
For a bond that pays fixed semi-annual coupons, how is the annual coupon rate defined, and how is the bond's annual income yield from time 0 to 1 defined mathematically?
Let: ##P_0## be the bond price now,
##F_T## be the bond's face value,
##T## be the bond's maturity in years,
##r_\text{total}## be the bond's total yield,
##r_\text{income}## be the bond's income yield,
##r_\text{capital}## be the bond's capital yield, and
##C_t## be the bond's coupon at time t in years. So ##C_{0.5}## is the coupon in 6 months, ##C_1## is the coupon in 1 year, and so on.
Question 315 foreign exchange rate, American and European terms
If the current AUD exchange rate is USD 0.9686 = AUD 1, what is the European terms quote of the AUD against the USD?
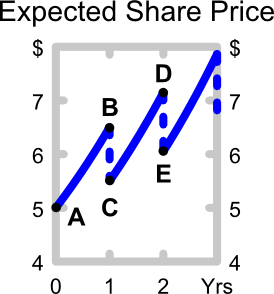
The perpetuity with growth formula, also known as the dividend discount model (DDM) or Gordon growth model, is appropriate for valuing a company's shares. ##P_0## is the current share price, ##C_1## is next year's expected dividend, ##r## is the total required return and ##g## is the expected growth rate of the dividend.
###P_0=\dfrac{C_1}{r-g}###
The below graph shows the expected future price path of the company's shares. Which of the following statements about the graph is NOT correct?
Question 636 option, option payoff at maturity, no explanation
Which of the below formulas gives the payoff ##(f)## at maturity ##(T)## from being long a call option? Let the underlying asset price at maturity be ##S_T## and the exercise price be ##X_T##.
Examine the graph of the AUD versus the USD, EUR and JPY. Note that RHS means right hand side and LHS left hand side which indicates which axis each line corresponds to. Assume inflation rates in each country were equal over the time period 1984 to 2018.
Which of the following statements is NOT correct?
Question 923 omitted variable bias, CAPM, single factor model, single index model, no explanation
Capital Asset Pricing Model (CAPM) and the Single Index Model (SIM) are single factor models whose only risk factor is the market portfolio’s return. Say a Taxi company and an Umbrella company are influenced by two factors, the market portfolio return and rainfall. When it rains, both the Taxi and Umbrella companies’ stock prices do well. When there’s no rain, both do poorly. Assume that rainfall risk is a systematic risk that cannot be diversified and that rainfall has zero correlation with the market portfolio’s returns.
Which of the following statements about these two stocks is NOT correct?
The CAPM and SIM: