A stock is expected to pay the following dividends:
| Cash Flows of a Stock | ||||||
| Time (yrs) | 0 | 1 | 2 | 3 | 4 | ... |
| Dividend ($) | 0.00 | 1.00 | 1.05 | 1.10 | 1.15 | ... |
After year 4, the annual dividend will grow in perpetuity at 5% pa, so;
- the dividend at t=5 will be $1.15(1+0.05),
- the dividend at t=6 will be $1.15(1+0.05)^2, and so on.
The required return on the stock is 10% pa. Both the growth rate and required return are given as effective annual rates.
What will be the price of the stock in three and a half years (t = 3.5)?
A wholesale horticulture nursery offers credit to its customers.
Customers are given 60 days to pay for their goods, but if they pay immediately they will get a 3% discount.
What is the effective interest rate implicit in the discount being offered? Assume 365 days in a year and that all customers pay either immediately or on the 60th day. All rates given below are effective annual rates.
You just borrowed $400,000 in the form of a 25 year interest-only mortgage with monthly payments of $3,000 per month. The interest rate is 9% pa which is not expected to change.
You actually plan to pay more than the required interest payment. You plan to pay $3,300 in mortgage payments every month, which your mortgage lender allows. These extra payments will reduce the principal and the minimum interest payment required each month.
At the maturity of the mortgage, what will be the principal? That is, after the last (300th) interest payment of $3,300 in 25 years, how much will be owing on the mortgage?
The CAPM can be used to find a business's expected opportunity cost of capital:
###r_i=r_f+β_i (r_m-r_f)###
What should be used as the risk free rate ##r_f##?
Read the following financial statements and calculate the firm's free cash flow over the 2014 financial year.
| UBar Corp | ||
| Income Statement for | ||
| year ending 30th June 2014 | ||
| $m | ||
| Sales | 293 | |
| COGS | 200 | |
| Rent expense | 15 | |
| Gas expense | 8 | |
| Depreciation | 10 | |
| EBIT | 60 | |
| Interest expense | 0 | |
| Taxable income | 60 | |
| Taxes | 18 | |
| Net income | 42 | |
| UBar Corp | ||
| Balance Sheet | ||
| as at 30th June | 2014 | 2013 |
| $m | $m | |
| Assets | ||
| Cash | 30 | 29 |
| Accounts receivable | 5 | 7 |
| Pre-paid rent expense | 1 | 0 |
| Inventory | 50 | 46 |
| PPE | 290 | 300 |
| Total assets | 376 | 382 |
| Liabilities | ||
| Trade payables | 20 | 18 |
| Accrued gas expense | 3 | 2 |
| Non-current liabilities | 0 | 0 |
| Contributed equity | 212 | 212 |
| Retained profits | 136 | 150 |
| Asset revaluation reserve | 5 | 0 |
| Total L and OE | 376 | 382 |
Note: all figures are given in millions of dollars ($m).
The firm's free cash flow over the 2014 financial year was:
Question 572 bond pricing, zero coupon bond, term structure of interest rates, expectations hypothesis, forward interest rate, yield curve
In the below term structure of interest rates equation, all rates are effective annual yields and the numbers in subscript represent the years that the yields are measured over:
###(1+r_{0-3})^3 = (1+r_{0-1})(1+r_{1-2})(1+r_{2-3}) ###
Which of the following statements is NOT correct?
Question 598 future, tailing the hedge, cross hedging
The standard deviation of monthly changes in the spot price of lamb is $0.015 per pound. The standard deviation of monthly changes in the futures price of live cattle is $0.012 per pound. The correlation between the spot price of lamb and the futures price of cattle is 0.4.
It is now January. A lamb producer is committed to selling 1,000,000 pounds of lamb in May. The spot price of live cattle is $0.30 per pound and the June futures price is $0.32 per pound. The spot price of lamb is $0.60 per pound.
The producer wants to use the June live cattle futures contracts to hedge his risk. Each futures contract is for the delivery of 50,000 pounds of cattle.
How many live cattle futures should the lamb farmer sell to hedge his risk? Round your answer to the nearest whole number of contracts.
Question 664 real and nominal returns and cash flows, inflation, no explanation
What is the present value of real payments of $100 every year forever, with the first payment in one year? The nominal discount rate is 7% pa and the inflation rate is 4% pa.
An effective semi-annual return of 5% ##(r_\text{eff 6mth})## is equivalent to an effective annual return ##(r_\text{eff annual})## of:
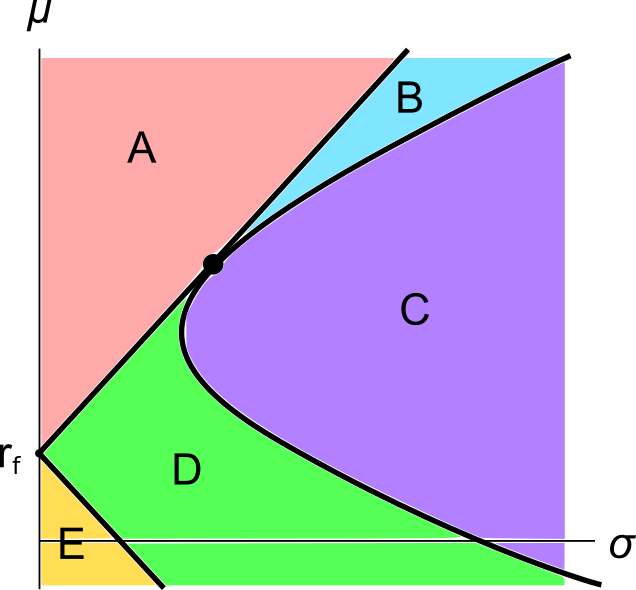
A graph of assets’ expected returns ##(\mu)## versus standard deviations ##(\sigma)## is given in the below diagram.
Each letter corresponds to a separate coloured area. The portfolios at the boundary of the areas, on the black lines, are excluded from each area. Assume that all assets represented in this graph are fairly priced, and that all risky assets can be short-sold.
Which of the following statements about this graph and Markowitz portfolio theory is NOT correct?