| Portfolio Details | ||||||
| Stock | Expected return |
Standard deviation |
Covariance ##(\sigma_{A,B})## | Beta | Dollars invested |
|
| A | 0.2 | 0.4 | 0.12 | 0.5 | 40 | |
| B | 0.3 | 0.8 | 1.5 | 80 | ||
What is the standard deviation (not variance) of the above portfolio? Note that the stocks' covariance is given, not correlation.
Find Candys Corporation's Cash Flow From Assets (CFFA), also known as Free Cash Flow to the Firm (FCFF), over the year ending 30th June 2013.
| Candys Corp | ||
| Income Statement for | ||
| year ending 30th June 2013 | ||
| $m | ||
| Sales | 200 | |
| COGS | 50 | |
| Operating expense | 10 | |
| Depreciation | 20 | |
| Interest expense | 10 | |
| Income before tax | 110 | |
| Tax at 30% | 33 | |
| Net income | 77 | |
| Candys Corp | ||
| Balance Sheet | ||
| as at 30th June | 2013 | 2012 |
| $m | $m | |
| Assets | ||
| Current assets | 220 | 180 |
| PPE | ||
| Cost | 300 | 340 |
| Accumul. depr. | 60 | 40 |
| Carrying amount | 240 | 300 |
| Total assets | 460 | 480 |
| Liabilities | ||
| Current liabilities | 175 | 190 |
| Non-current liabilities | 135 | 130 |
| Owners' equity | ||
| Retained earnings | 50 | 60 |
| Contributed equity | 100 | 100 |
| Total L and OE | 460 | 480 |
Note: all figures are given in millions of dollars ($m).
A European call option will mature in ##T## years with a strike price of ##K## dollars. The underlying asset has a price of ##S## dollars.
What is an expression for the payoff at maturity ##(f_T)## in dollars from owning (being long) the call option?
Question 572 bond pricing, zero coupon bond, term structure of interest rates, expectations hypothesis, forward interest rate, yield curve
In the below term structure of interest rates equation, all rates are effective annual yields and the numbers in subscript represent the years that the yields are measured over:
###(1+r_{0-3})^3 = (1+r_{0-1})(1+r_{1-2})(1+r_{2-3}) ###
Which of the following statements is NOT correct?
Which one of the below option and futures contracts gives the possibility of potentially unlimited gains?
The standard deviation of monthly changes in the spot price of corn is 50 cents per bushel. The standard deviation of monthly changes in the futures price of corn is 40 cents per bushel. The correlation between the spot price of corn and the futures price of corn is 0.9.
It is now March. A corn chip manufacturer is committed to buying 250,000 bushels of corn in May. The spot price of corn is 381 cents per bushel and the June futures price is 399 cents per bushel.
The corn chip manufacturer wants to use the June corn futures contracts to hedge his risk. Each futures contract is for the delivery of 5,000 bushels of corn. One bushel is about 127 metric tons.
How many corn futures should the corn chip manufacturer buy to hedge his risk? Round your answer to the nearest whole number of contracts. Remember to tail the hedge.
Question 976 comparative advantage in trade, production possibilities curve, no explanation
Arthur and Bindi are the only people on a remote island. Their production possibility curves are shown in the graph.
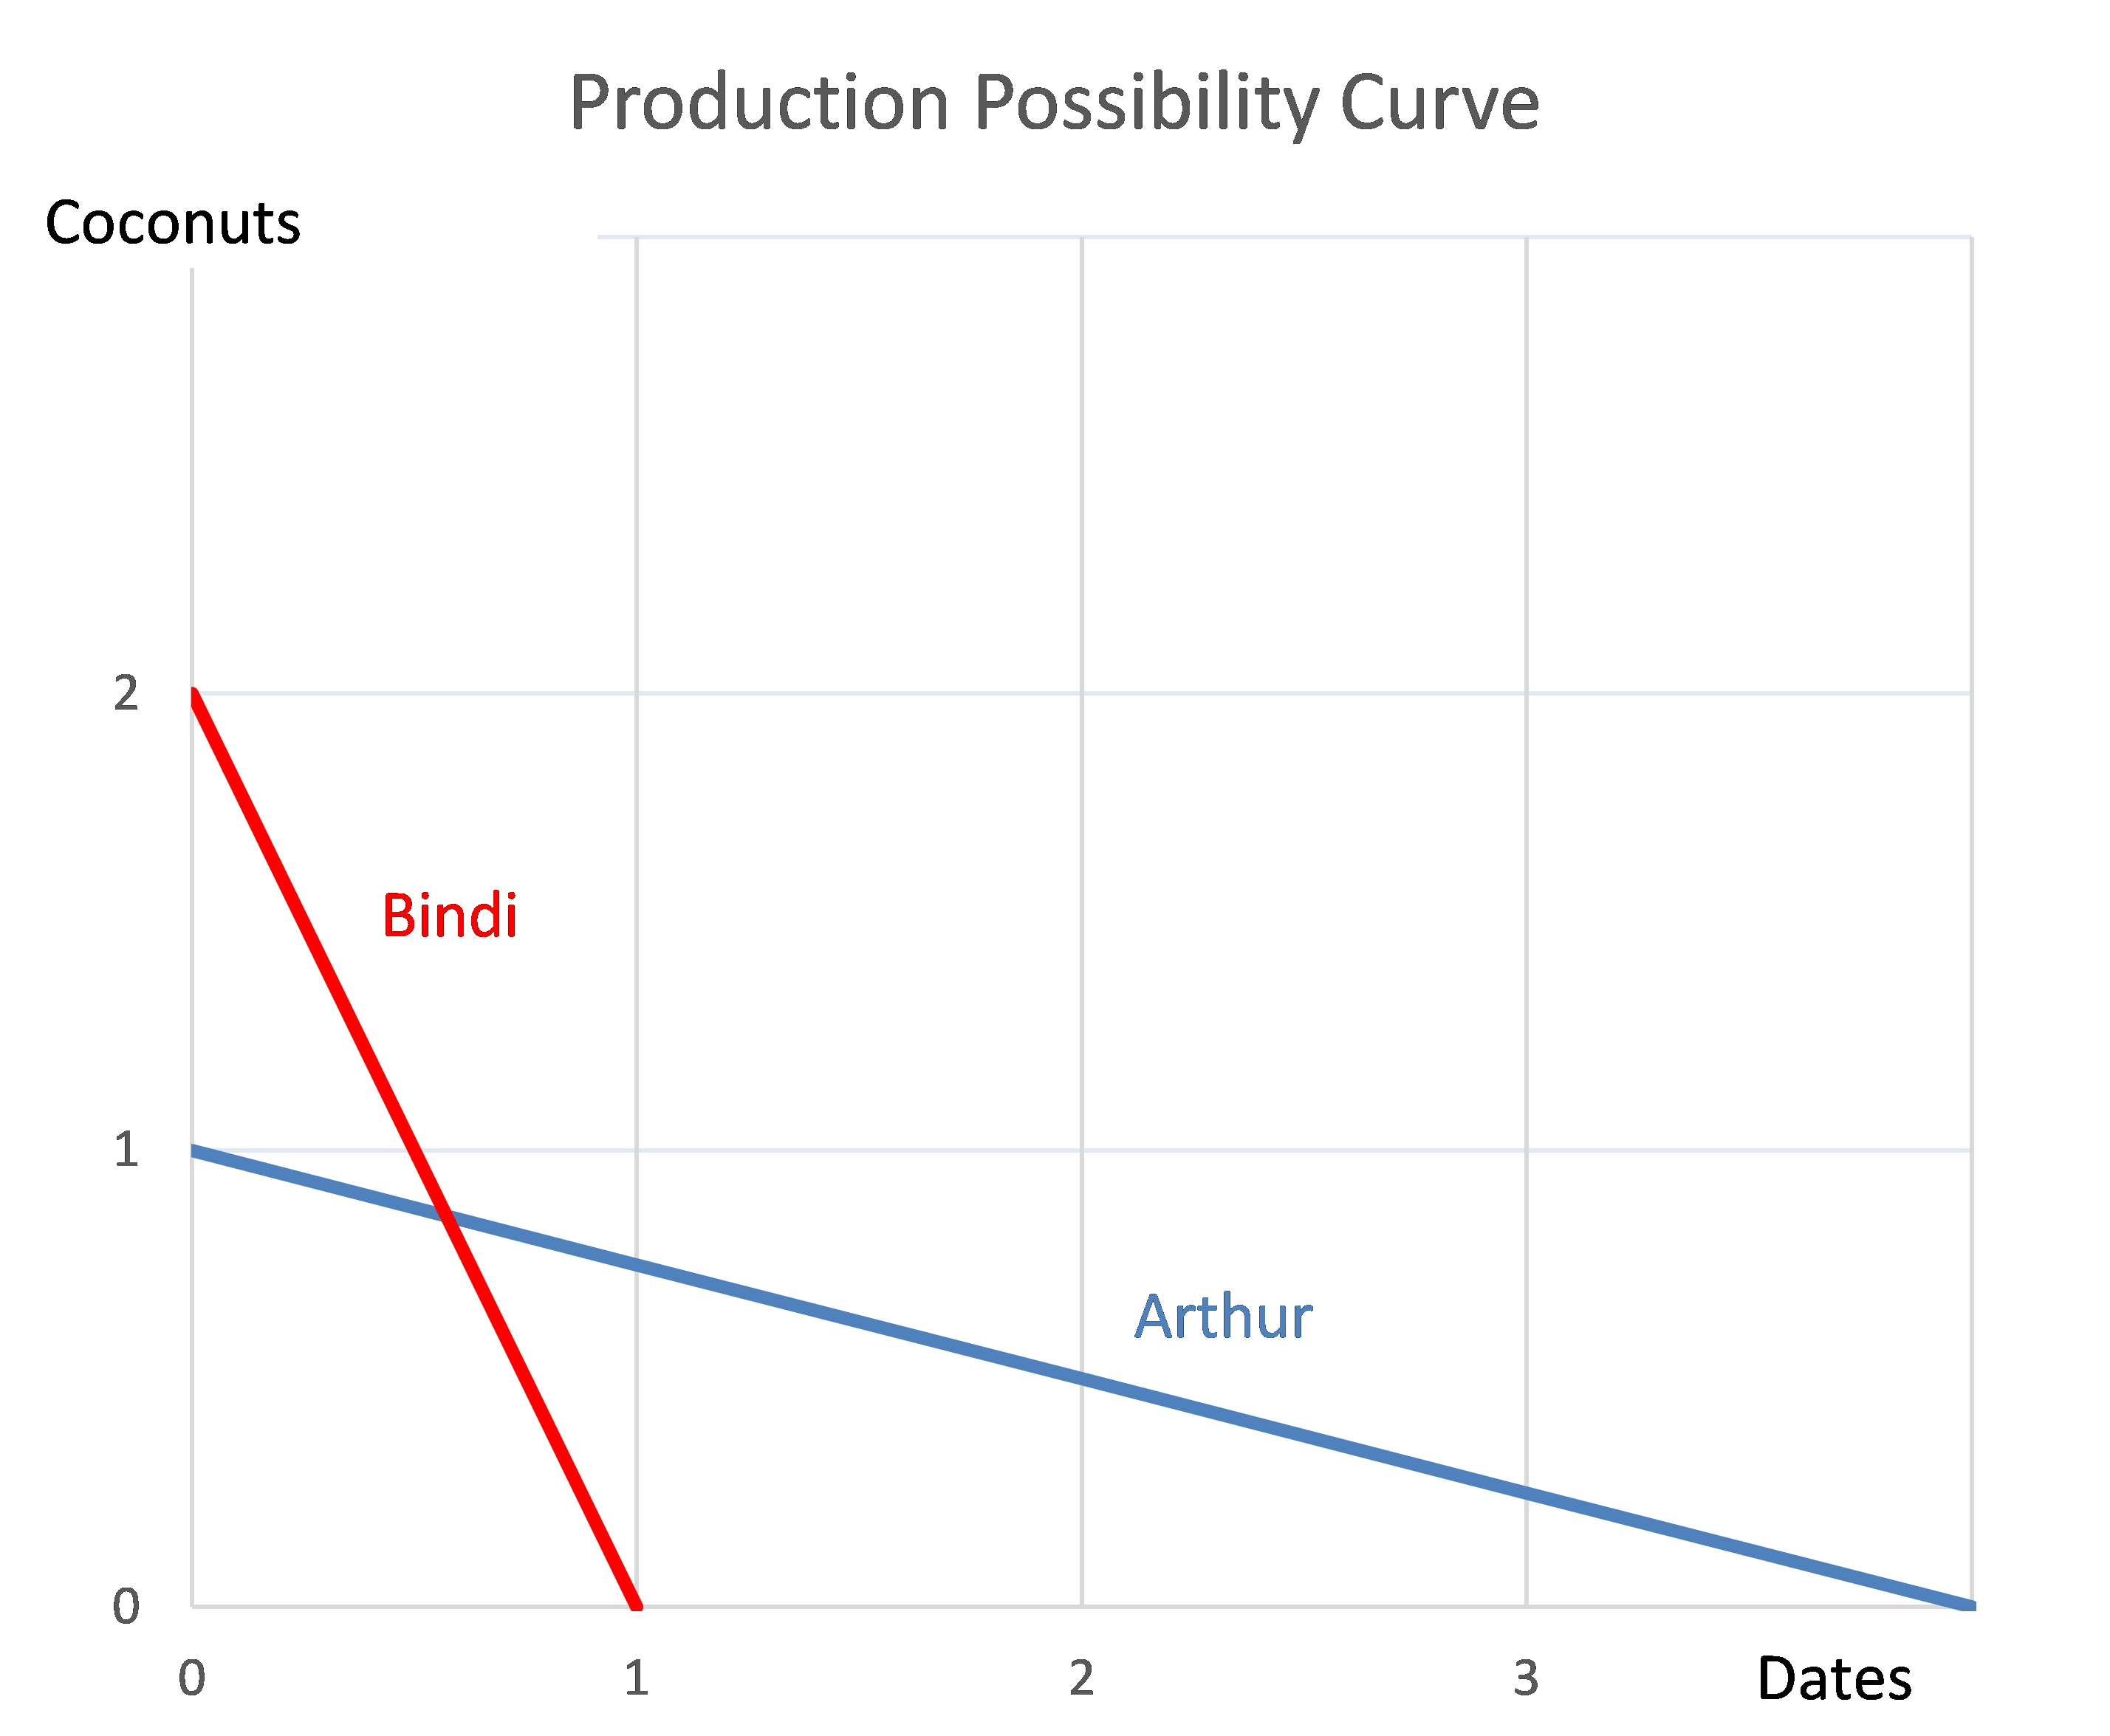
Which of the following statements is NOT correct?