All things remaining equal, the variance of a portfolio of two positively-weighted stocks rises as:
A firm has forecast its Cash Flow From Assets (CFFA) for this year and management is worried that it is too low. Which one of the following actions will lead to a higher CFFA for this year (t=0 to 1)? Only consider cash flows this year. Do not consider cash flows after one year, or the change in the NPV of the firm. Consider each action in isolation.
Question 335 foreign exchange rate, American and European terms
Investors expect Australia's central bank, the RBA, to reduce the policy rate at their next meeting due to fears that the economy is slowing. Then unexpectedly, the policy rate is actually kept unchanged.
What do you expect to happen to Australia's exchange rate?
There are many ways to calculate a firm's free cash flow (FFCF), also called cash flow from assets (CFFA). Some include the annual interest tax shield in the cash flow and some do not.
Which of the below FFCF formulas include the interest tax shield in the cash flow?
###(1) \quad FFCF=NI + Depr - CapEx -ΔNWC + IntExp### ###(2) \quad FFCF=NI + Depr - CapEx -ΔNWC + IntExp.(1-t_c)### ###(3) \quad FFCF=EBIT.(1-t_c )+ Depr- CapEx -ΔNWC+IntExp.t_c### ###(4) \quad FFCF=EBIT.(1-t_c) + Depr- CapEx -ΔNWC### ###(5) \quad FFCF=EBITDA.(1-t_c )+Depr.t_c- CapEx -ΔNWC+IntExp.t_c### ###(6) \quad FFCF=EBITDA.(1-t_c )+Depr.t_c- CapEx -ΔNWC### ###(7) \quad FFCF=EBIT-Tax + Depr - CapEx -ΔNWC### ###(8) \quad FFCF=EBIT-Tax + Depr - CapEx -ΔNWC-IntExp.t_c### ###(9) \quad FFCF=EBITDA-Tax - CapEx -ΔNWC### ###(10) \quad FFCF=EBITDA-Tax - CapEx -ΔNWC-IntExp.t_c###The formulas for net income (NI also called earnings), EBIT and EBITDA are given below. Assume that depreciation and amortisation are both represented by 'Depr' and that 'FC' represents fixed costs such as rent.
###NI=(Rev - COGS - Depr - FC - IntExp).(1-t_c )### ###EBIT=Rev - COGS - FC-Depr### ###EBITDA=Rev - COGS - FC### ###Tax =(Rev - COGS - Depr - FC - IntExp).t_c= \dfrac{NI.t_c}{1-t_c}###Question 523 income and capital returns, real and nominal returns and cash flows, inflation
A low-growth mature stock has an expected nominal total return of 6% pa and nominal capital return of 2% pa. Inflation is expected to be 3% pa.
All of the above are effective nominal rates and investors believe that they will stay the same in perpetuity.
What are the stock's expected real total, capital and income returns?
The answer choices below are given in the same order.
A stock has a beta of 1.5. The market's expected total return is 10% pa and the risk free rate is 5% pa, both given as effective annual rates.
In the last 5 minutes, bad economic news was released showing a higher chance of recession. Over this time the share market fell by 1%. The risk free rate was unchanged.
What do you think was the stock's historical return over the last 5 minutes, given as an effective 5 minute rate?
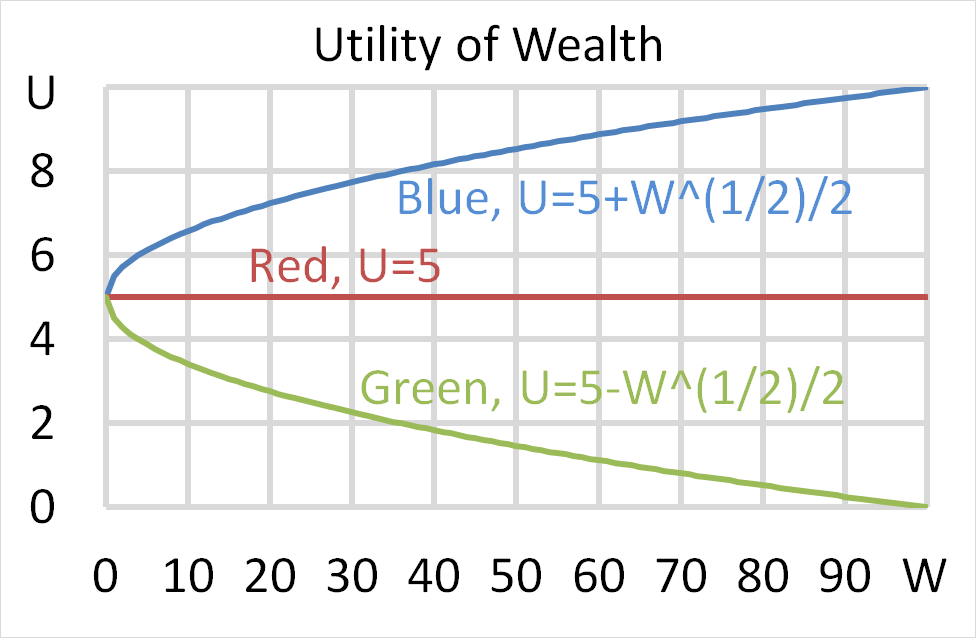
Question 700 utility, risk aversion, utility function, gamble
Mr Blue, Miss Red and Mrs Green are people with different utility functions.
Each person has $50 of initial wealth. A coin toss game is offered to each person at a casino where the player can win or lose $50. Each player can flip a coin and if they flip heads, they receive $50. If they flip tails then they will lose $50. Which of the following statements is NOT correct?
Below is the Australian federal government’s budget balance as a percent of GDP. Note that the columns to the right of the vertical black line were a forecast at the time. The x-axis shows financial years, so for example the 06/07 financial year represents the time period from 1 July 2006 to 30 June 2007.
Comparing the 2008/09 financial year to the previous one, the Australian federal government implemented: