A share just paid its semi-annual dividend of $10. The dividend is expected to grow at 2% every 6 months forever. This 2% growth rate is an effective 6 month rate. Therefore the next dividend will be $10.20 in six months. The required return of the stock is 10% pa, given as an effective annual rate.
What is the price of the share now?
Which of the below statements about effective rates and annualised percentage rates (APR's) is NOT correct?
Question 526 real and nominal returns and cash flows, inflation, no explanation
How can a nominal cash flow be precisely converted into a real cash flow?
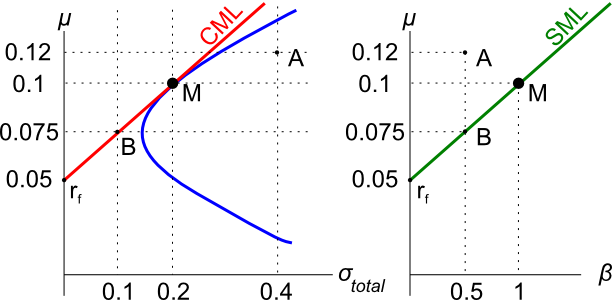
Assets A, B, M and ##r_f## are shown on the graphs above. Asset M is the market portfolio and ##r_f## is the risk free yield on government bonds. Which of the below statements is NOT correct?
Question 637 option, option payoff at maturity, no explanation
Which of the below formulas gives the payoff ##(f)## at maturity ##(T)## from being short a call option? Let the underlying asset price at maturity be ##S_T## and the exercise price be ##X_T##.
Question 691 continuously compounding rate, effective rate, continuously compounding rate conversion, no explanation
A bank quotes an interest rate of 6% pa with quarterly compounding. Note that another way of stating this rate is that it is an annual percentage rate (APR) compounding discretely every 3 months.
Which of the following statements about this rate is NOT correct? All percentages are given to 6 decimal places. The equivalent:
A firm wishes to raise $50 million now. They will issue 5% pa semi-annual coupon bonds that will mature in 3 years and have a face value of $100 each. Bond yields are 6% pa, given as an APR compounding every 6 months, and the yield curve is flat.
How many bonds should the firm issue?
Question 802 negative gearing, leverage, capital structure, no explanation
Which of the following statements about ‘negative gearing’ is NOT correct?
Question 850 gross domestic product, gross domestic product per capita
Below is a table showing some countries’ GDP, population and GDP per capita.
| Countries' GDP and Population | |||
| GDP | Population | GDP per capita | |
| USD million | millions of people | USD | |
| United States | 18,036,648 | 325 | 55,492 |
| China | 11,158,457 | 1,383 | 8,066 |
| Japan | 4,383,076 | 127 | 34,586 |
| Germany | 3,363,600 | 83 | 40,623 |
| Norway | 500,519 | 5 | 95,027 |
Source: "GDP and its breakdown at current prices in US Dollars" United Nations Statistics Division. December 2016.
Using this data only, which one of these countries’ citizens have the highest living standards?