Bonds X and Y are issued by the same US company. Both bonds yield 10% pa, and they have the same face value ($100), maturity, seniority, and payment frequency.
The only difference is that bond X and Y's coupon rates are 8 and 12% pa respectively. Which of the following statements is true?
A stock pays annual dividends which are expected to continue forever. It just paid a dividend of $10. The growth rate in the dividend is 2% pa. You estimate that the stock's required return is 10% pa. Both the discount rate and growth rate are given as effective annual rates. Using the dividend discount model, what will be the share price?
Diversification is achieved by investing in a large amount of stocks. What type of risk is reduced by diversification?
You're considering making an investment in a particular company. They have preference shares, ordinary shares, senior debt and junior debt.
Which is the safest investment? Which has the highest expected returns?
Question 339 bond pricing, inflation, market efficiency, income and capital returns
Economic statistics released this morning were a surprise: they show a strong chance of consumer price inflation (CPI) reaching 5% pa over the next 2 years.
This is much higher than the previous forecast of 3% pa.
A vanilla fixed-coupon 2-year risk-free government bond was issued at par this morning, just before the economic news was released.
What is the expected change in bond price after the economic news this morning, and in the next 2 years? Assume that:
- Inflation remains at 5% over the next 2 years.
- Investors demand a constant real bond yield.
- The bond price falls by the (after-tax) value of the coupon the night before the ex-coupon date, as in real life.
The perpetuity with growth formula, also known as the dividend discount model (DDM) or Gordon growth model, is appropriate for valuing a company's shares. ##P_0## is the current share price, ##C_1## is next year's expected dividend, ##r## is the total required return and ##g## is the expected growth rate of the dividend.
###P_0=\dfrac{C_1}{r-g}###
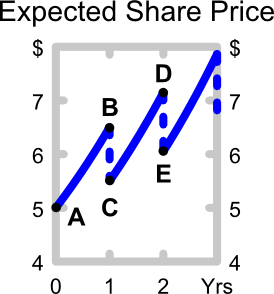
The below graph shows the expected future price path of the company's shares. Which of the following statements about the graph is NOT correct?
You have $100,000 in the bank. The bank pays interest at 10% pa, given as an effective annual rate.
You wish to consume twice as much now (t=0) as in one year (t=1) and have nothing left in the bank at the end.
How much can you consume at time zero and one? The answer choices are given in the same order.
Question 748 income and capital returns, DDM, ex dividend date
A stock will pay you a dividend of $2 tonight if you buy it today.
Thereafter the annual dividend is expected to grow by 3% pa, so the next dividend after the $2 one tonight will be $2.06 in one year, then in two years it will be $2.1218 and so on. The stock's required return is 8% pa.
What is the stock price today and what do you expect the stock price to be tomorrow, approximately?
This question is about the Balance of Payments. Australia's current account as a percent of nominal gross domestic product (GDP) per annum is shown in the graph below.
Assume that all foreign and domestic assets are either debt which makes interest income or equity which makes dividend income, and vice versa for liabilities which cost interest and dividend payments, respectively.
Which of the following statements is NOT correct?
Question 928 mean and median returns, mode return, return distribution, arithmetic and geometric averages, continuously compounding rate, no explanation
The arithmetic average continuously compounded or log gross discrete return (AALGDR) on the ASX200 accumulation index over the 24 years from 31 Dec 1992 to 31 Dec 2016 is 9.49% pa.
The arithmetic standard deviation (SDLGDR) is 16.92 percentage points pa.
Assume that the log gross discrete returns are normally distributed and that the above estimates are true population statistics, not sample statistics, so there is no standard error in the sample mean or standard deviation estimates. Also assume that the standardised normal Z-statistic corresponding to a one-tail probability of 2.5% is exactly -1.96.
If you had a $1 million fund that replicated the ASX200 accumulation index, in how many years would the mode dollar value of your fund first be expected to lie outside the 95% confidence interval forecast?
Note that the mode of a log-normally distributed future price is: ##P_{T \text{ mode}} = P_0.e^{(\text{AALGDR} - \text{SDLGDR}^2 ).T} ##