Bonds A and B are issued by the same company. They have the same face value, maturity, seniority and coupon payment frequency. The only difference is that bond A has a 5% coupon rate, while bond B has a 10% coupon rate. The yield curve is flat, which means that yields are expected to stay the same.
Which bond would have the higher current price?
A firm changes its capital structure by issuing a large amount of equity and using the funds to repay debt. Its assets are unchanged. Ignore interest tax shields.
According to the Capital Asset Pricing Model (CAPM), which statement is correct?
You just signed up for a 30 year fully amortising mortgage loan with monthly payments of $2,000 per month. The interest rate is 9% pa which is not expected to change.
How much did you borrow? After 5 years, how much will be owing on the mortgage? The interest rate is still 9% and is not expected to change.
An old company's Firm Free Cash Flow (FFCF, same as CFFA) is forecast in the graph below.
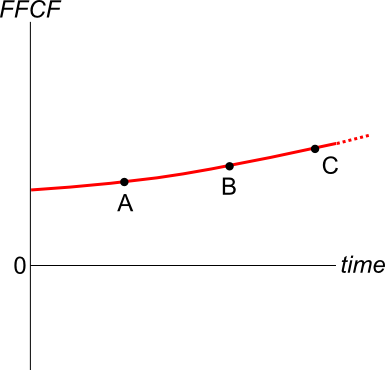
To value the firm's assets, the terminal value needs to be calculated using the perpetuity with growth formula:
###V_{\text{terminal, }t-1} = \dfrac{FFCF_{\text{terminal, }t}}{r-g}###
Which point corresponds to the best time to calculate the terminal value?
Question 418 capital budgeting, NPV, interest tax shield, WACC, CFFA, CAPM
| Project Data | ||
| Project life | 1 year | |
| Initial investment in equipment | $8m | |
| Depreciation of equipment per year | $8m | |
| Expected sale price of equipment at end of project | 0 | |
| Unit sales per year | 4m | |
| Sale price per unit | $10 | |
| Variable cost per unit | $5 | |
| Fixed costs per year, paid at the end of each year | $2m | |
| Interest expense in first year (at t=1) | $0.562m | |
| Corporate tax rate | 30% | |
| Government treasury bond yield | 5% | |
| Bank loan debt yield | 9% | |
| Market portfolio return | 10% | |
| Covariance of levered equity returns with market | 0.32 | |
| Variance of market portfolio returns | 0.16 | |
| Firm's and project's debt-to-equity ratio | 50% | |
Notes
- Due to the project, current assets will increase by $6m now (t=0) and fall by $6m at the end (t=1). Current liabilities will not be affected.
Assumptions
- The debt-to-equity ratio will be kept constant throughout the life of the project. The amount of interest expense at the end of each period has been correctly calculated to maintain this constant debt-to-equity ratio.
- Millions are represented by 'm'.
- All cash flows occur at the start or end of the year as appropriate, not in the middle or throughout the year.
- All rates and cash flows are real. The inflation rate is 2% pa. All rates are given as effective annual rates.
- The project is undertaken by a firm, not an individual.
What is the net present value (NPV) of the project?
A trader buys one crude oil European style call option contract on the CME expiring in one year with an exercise price of $44 per barrel for a price of $6.64. The crude oil spot price is $40.33. If the trader doesn’t close out her contract before maturity, then at maturity she will have the:
Calculate Australia’s GDP over the 2016 calendar year using the below table:
| Australian Gross Domestic Product Components | ||||
| A$ billion, 2016 Calendar Year from 1 Jan 2016 to 31 Dec 2016 inclusive | ||||
| Consumption | Investment | Government spending | Exports | Imports |
| 971 | 421 | 320 | 328 | 344 |
Source: ABS 5206.0 Australian National Accounts: National Income, Expenditure and Product. Table 3. Expenditure on Gross Domestic Product (GDP), Current prices.
Over the 2016 calendar year, Australia’s GDP was:
Question 850 gross domestic product, gross domestic product per capita
Below is a table showing some countries’ GDP, population and GDP per capita.
| Countries' GDP and Population | |||
| GDP | Population | GDP per capita | |
| USD million | millions of people | USD | |
| United States | 18,036,648 | 325 | 55,492 |
| China | 11,158,457 | 1,383 | 8,066 |
| Japan | 4,383,076 | 127 | 34,586 |
| Germany | 3,363,600 | 83 | 40,623 |
| Norway | 500,519 | 5 | 95,027 |
Source: "GDP and its breakdown at current prices in US Dollars" United Nations Statistics Division. December 2016.
Using this data only, which one of these countries’ citizens have the highest living standards?
A non-dividend paying stock has a current price of $20.
The risk free rate is 5% pa given as a continuously compounded rate.
Options on the stock are currently priced at $5 for calls and $5.55 for puts where both options have a 2 year maturity and an exercise price of $24.
You suspect that the call option contract is mis-priced and would like to conduct a risk-free arbitrage that requires zero capital. Which of the following steps about arbitraging the situation is NOT correct?