A stock is expected to pay the following dividends:
| Cash Flows of a Stock | ||||||
| Time (yrs) | 0 | 1 | 2 | 3 | 4 | ... |
| Dividend ($) | 0.00 | 1.00 | 1.05 | 1.10 | 1.15 | ... |
After year 4, the annual dividend will grow in perpetuity at 5% pa, so;
- the dividend at t=5 will be $1.15(1+0.05),
- the dividend at t=6 will be $1.15(1+0.05)^2, and so on.
The required return on the stock is 10% pa. Both the growth rate and required return are given as effective annual rates.
What will be the price of the stock in three and a half years (t = 3.5)?
You have $100,000 in the bank. The bank pays interest at 10% pa, given as an effective annual rate.
You wish to consume an equal amount now (t=0), in one year (t=1) and in two years (t=2), and still have $50,000 in the bank after that (t=2).
How much can you consume at each time?
Which one of the below statements about effective rates and annualised percentage rates (APR's) is NOT correct?
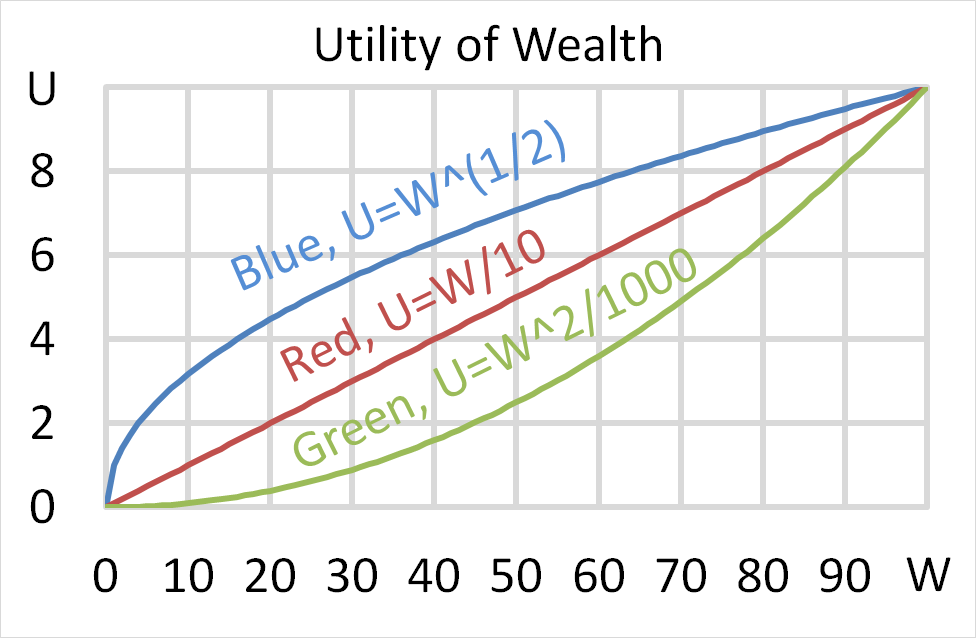
Question 699 utility, risk aversion, utility function, gamble
Mr Blue, Miss Red and Mrs Green are people with different utility functions.
Each person has $50 of initial wealth. A coin toss game is offered to each person at a casino where the player can win or lose $50. Each player can flip a coin and if they flip heads, they receive $50. If they flip tails then they will lose $50. Which of the following statements is NOT correct?
Question 719 mean and median returns, return distribution, arithmetic and geometric averages, continuously compounding rate
A stock has an arithmetic average continuously compounded return (AALGDR) of 10% pa, a standard deviation of continuously compounded returns (SDLGDR) of 80% pa and current stock price of $1. Assume that stock prices are log-normally distributed. The graph below summarises this information and provides some helpful formulas.
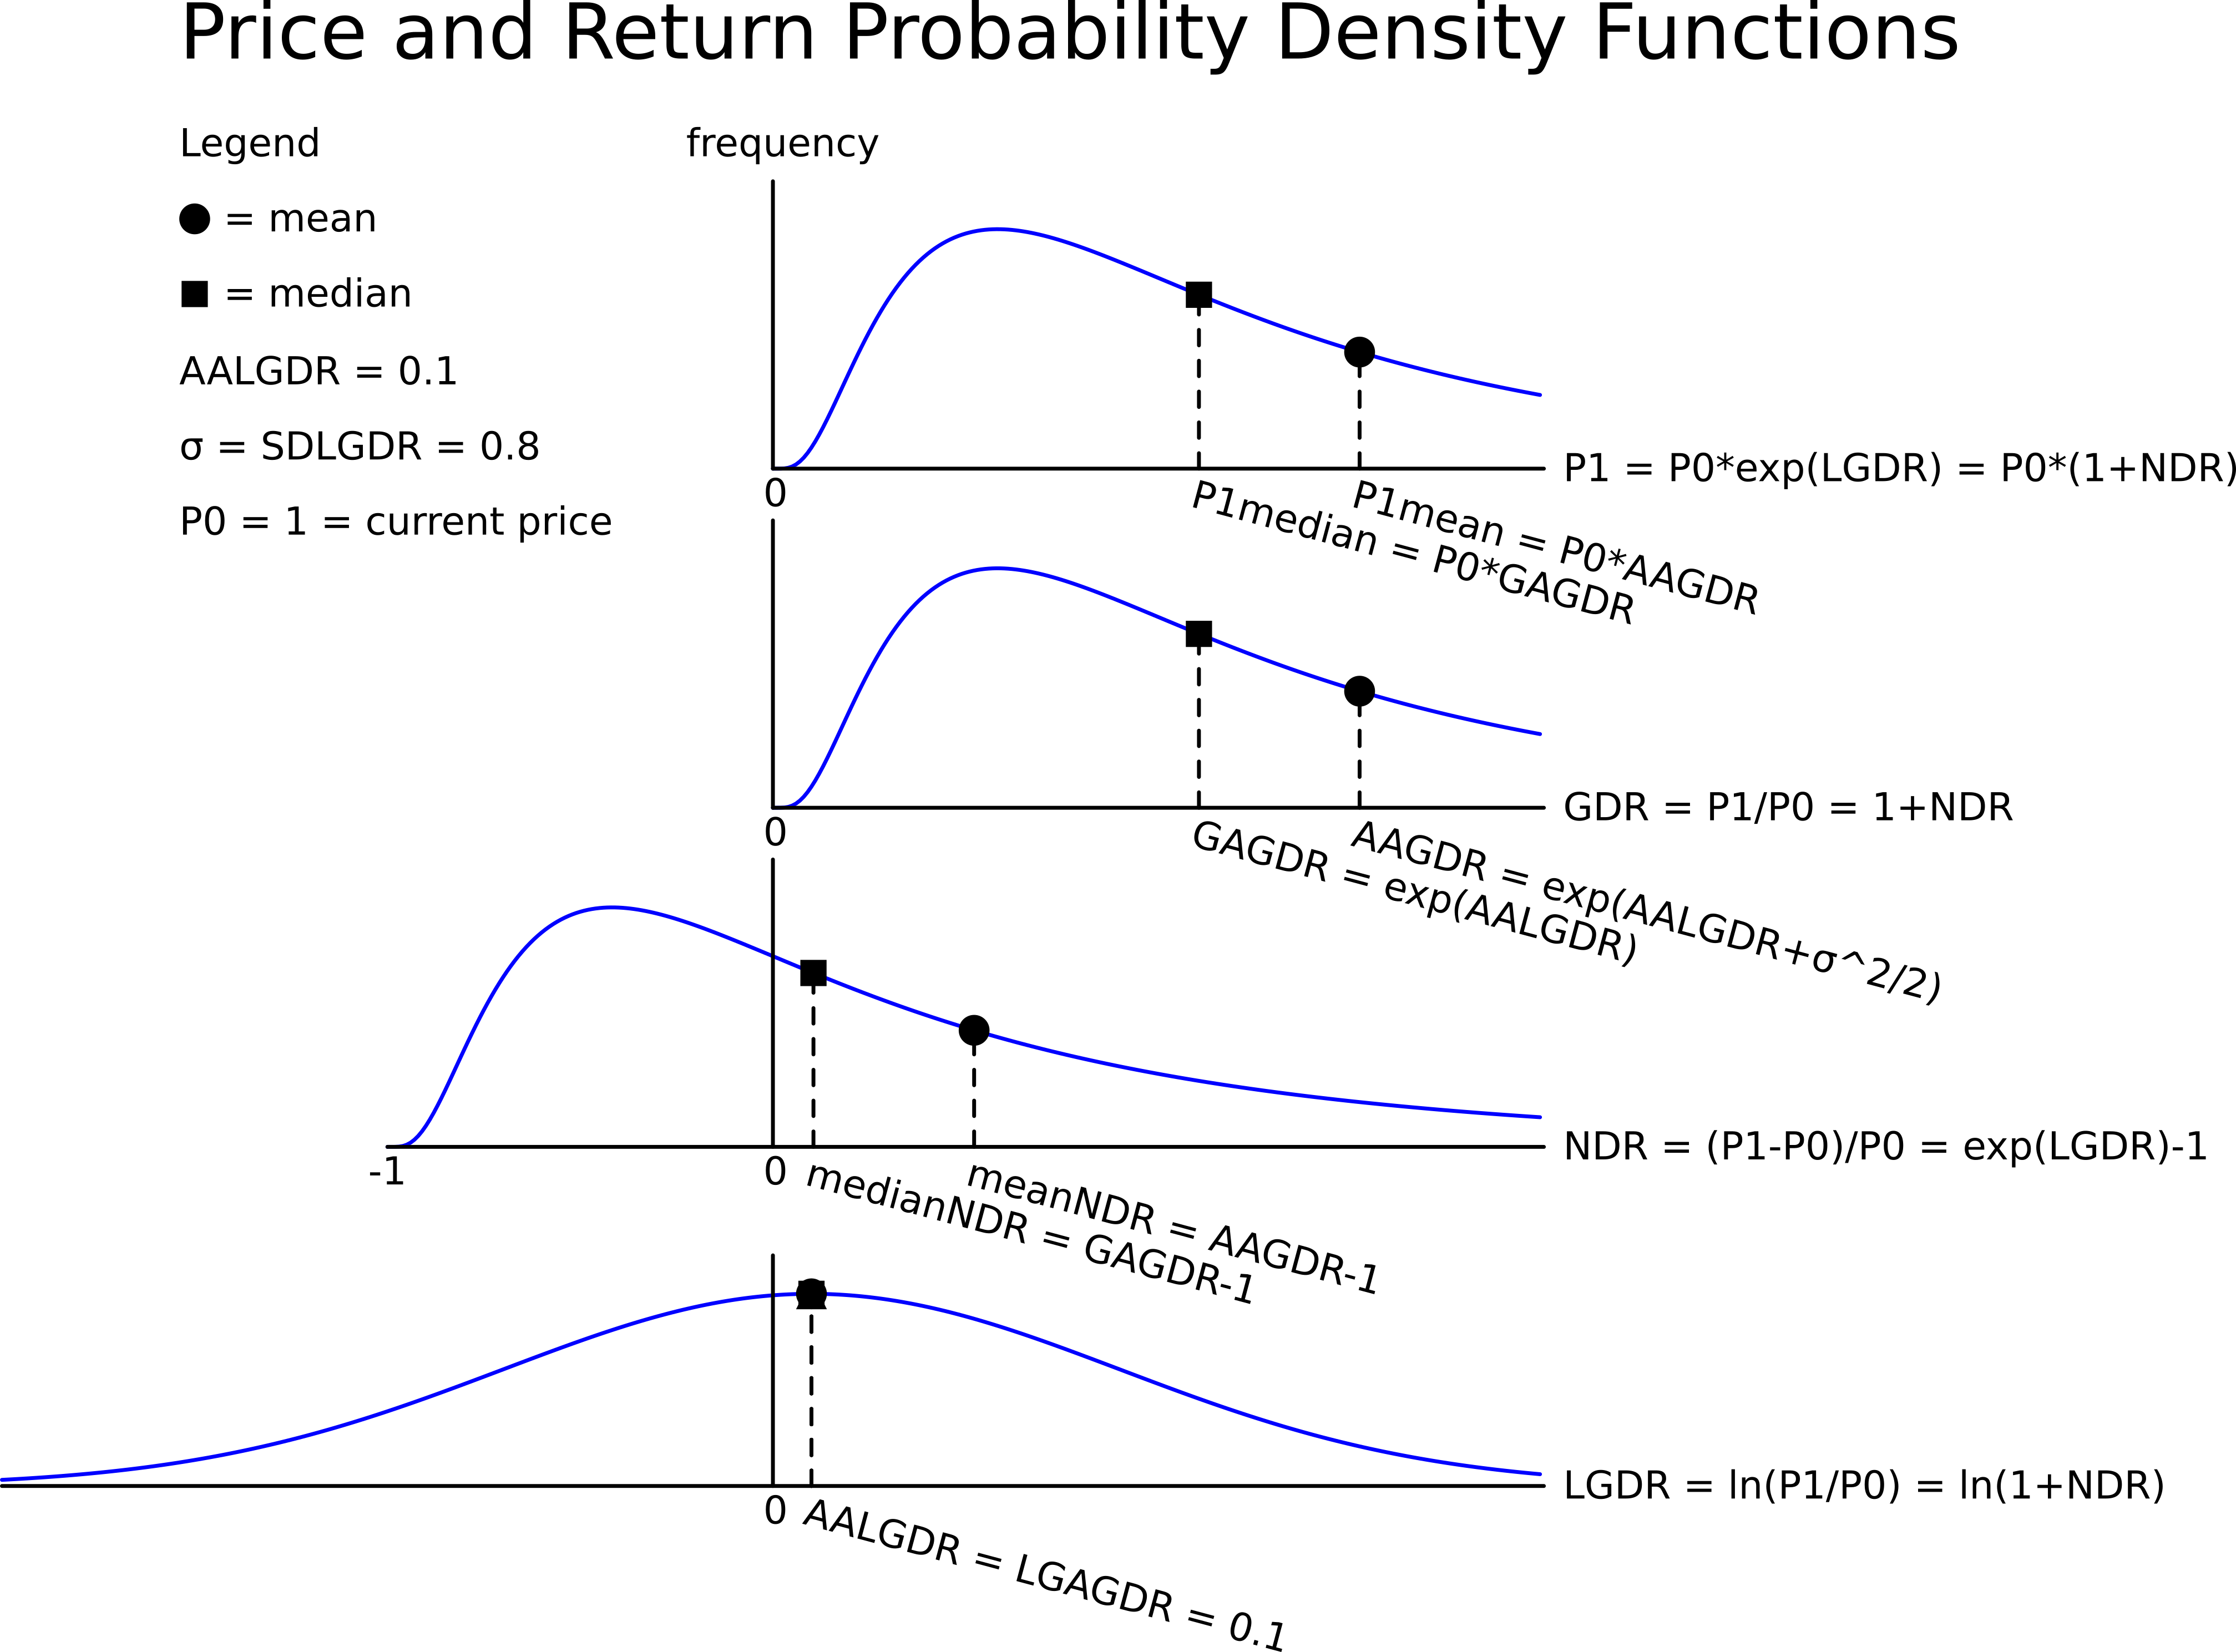
In one year, what do you expect the median and mean prices to be? The answer options are given in the same order.
What derivative position are you exposed to if you have the obligation to sell the underlying asset at maturity, so you will definitely be forced to sell the underlying asset?
The below diagram shows a firm’s cash cycle.
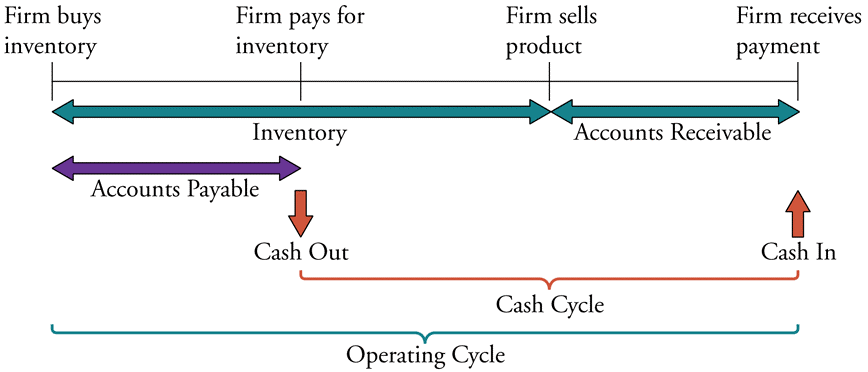
Which of the following statements about companies’ cash cycle is NOT correct?
Examine the graph of the AUD versus the USD, EUR and JPY. Note that RHS means right hand side and LHS left hand side which indicates which axis each line corresponds to. Assume inflation rates in each country were equal over the time period 1984 to 2018.
Which of the following statements is NOT correct?
Question 920 SML, CAPM, Sharpe ratio, Treynor ratio, Jensens alpha, no explanation
Over-priced assets should NOT: