Here are the Net Income (NI) and Cash Flow From Assets (CFFA) equations:
###NI=(Rev-COGS-FC-Depr-IntExp).(1-t_c)###
###CFFA=NI+Depr-CapEx - \varDelta NWC+IntExp###
What is the formula for calculating annual interest expense (IntExp) which is used in the equations above?
Select one of the following answers. Note that D is the value of debt which is constant through time, and ##r_D## is the cost of debt.
Question 155 inflation, real and nominal returns and cash flows, Loan, effective rate conversion
You are a banker about to grant a 2 year loan to a customer. The loan's principal and interest will be repaid in a single payment at maturity, sometimes called a zero-coupon loan, discount loan or bullet loan.
You require a real return of 6% pa over the two years, given as an effective annual rate. Inflation is expected to be 2% this year and 4% next year, both given as effective annual rates.
You judge that the customer can afford to pay back $1,000,000 in 2 years, given as a nominal cash flow. How much should you lend to her right now?
A firm wishes to raise $20 million now. They will issue 8% pa semi-annual coupon bonds that will mature in 5 years and have a face value of $100 each. Bond yields are 6% pa, given as an APR compounding every 6 months, and the yield curve is flat.
How many bonds should the firm issue?
Find UniBar Corp's Cash Flow From Assets (CFFA), also known as Free Cash Flow to the Firm (FCFF), over the year ending 30th June 2013.
| UniBar Corp | ||
| Income Statement for | ||
| year ending 30th June 2013 | ||
| $m | ||
| Sales | 80 | |
| COGS | 40 | |
| Operating expense | 15 | |
| Depreciation | 10 | |
| Interest expense | 5 | |
| Income before tax | 10 | |
| Tax at 30% | 3 | |
| Net income | 7 | |
| UniBar Corp | ||
| Balance Sheet | ||
| as at 30th June | 2013 | 2012 |
| $m | $m | |
| Assets | ||
| Current assets | 120 | 90 |
| PPE | ||
| Cost | 360 | 320 |
| Accumul. depr. | 40 | 30 |
| Carrying amount | 320 | 290 |
| Total assets | 440 | 380 |
| Liabilities | ||
| Current liabilities | 110 | 60 |
| Non-current liabilities | 190 | 180 |
| Owners' equity | ||
| Retained earnings | 95 | 95 |
| Contributed equity | 45 | 45 |
| Total L and OE | 440 | 380 |
Note: all figures are given in millions of dollars ($m).
A new company's Firm Free Cash Flow (FFCF, same as CFFA) is forecast in the graph below.
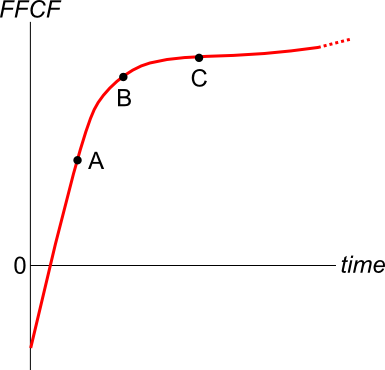
To value the firm's assets, the terminal value needs to be calculated using the perpetuity with growth formula:
###V_{\text{terminal, }t-1} = \dfrac{FFCF_{\text{terminal, }t}}{r-g}###
Which point corresponds to the best time to calculate the terminal value?
An asset's total expected return over the next year is given by:
###r_\text{total} = \dfrac{c_1+p_1-p_0}{p_0} ###
Where ##p_0## is the current price, ##c_1## is the expected income in one year and ##p_1## is the expected price in one year. The total return can be split into the income return and the capital return.
Which of the following is the expected capital return?
A trader sells one crude oil European style call option contract on the CME expiring in one year with an exercise price of $44 per barrel for a price of $6.64. The crude oil spot price is $40.33. If the trader doesn’t close out her contract before maturity, then at maturity she will have the:
The standard deviation of monthly changes in the spot price of corn is 50 cents per bushel. The standard deviation of monthly changes in the futures price of corn is 40 cents per bushel. The correlation between the spot price of corn and the futures price of corn is 0.9.
It is now March. A corn chip manufacturer is committed to buying 250,000 bushels of corn in May. The spot price of corn is 381 cents per bushel and the June futures price is 399 cents per bushel.
The corn chip manufacturer wants to use the June corn futures contracts to hedge his risk. Each futures contract is for the delivery of 5,000 bushels of corn. One bushel is about 127 metric tons.
How many corn futures should the corn chip manufacturer buy to hedge his risk? Round your answer to the nearest whole number of contracts. Remember to tail the hedge.
The market's expected total return is 10% pa and the risk free rate is 5% pa, both given as effective annual rates.
A stock has a beta of 0.5.
In the last 5 minutes, the federal government unexpectedly raised taxes. Over this time the share market fell by 3%. The risk free rate was unchanged.
What do you think was the stock's historical return over the last 5 minutes, given as an effective 5 minute rate?