| Portfolio Details | ||||||
| Stock | Expected return |
Standard deviation |
Correlation | Beta | Dollars invested |
|
| A | 0.2 | 0.4 | 0.12 | 0.5 | 40 | |
| B | 0.3 | 0.8 | 1.5 | 80 | ||
What is the beta of the above portfolio?
A stock was bought for $8 and paid a dividend of $0.50 one year later (at t=1 year). Just after the dividend was paid, the stock price was $7 (at t=1 year).
What were the total, capital and dividend returns given as effective annual rates? The choices are given in the same order:
##r_\text{total}##, ##r_\text{capital}##, ##r_\text{dividend}##.
Question 488 income and capital returns, payout policy, payout ratio, DDM
Two companies BigDiv and ZeroDiv are exactly the same except for their dividend payouts.
BigDiv pays large dividends and ZeroDiv doesn't pay any dividends.
Currently the two firms have the same earnings, assets, number of shares, share price, expected total return and risk.
Assume a perfect world with no taxes, no transaction costs, no asymmetric information and that all assets including business projects are fairly priced and therefore zero-NPV.
All things remaining equal, which of the following statements is NOT correct?
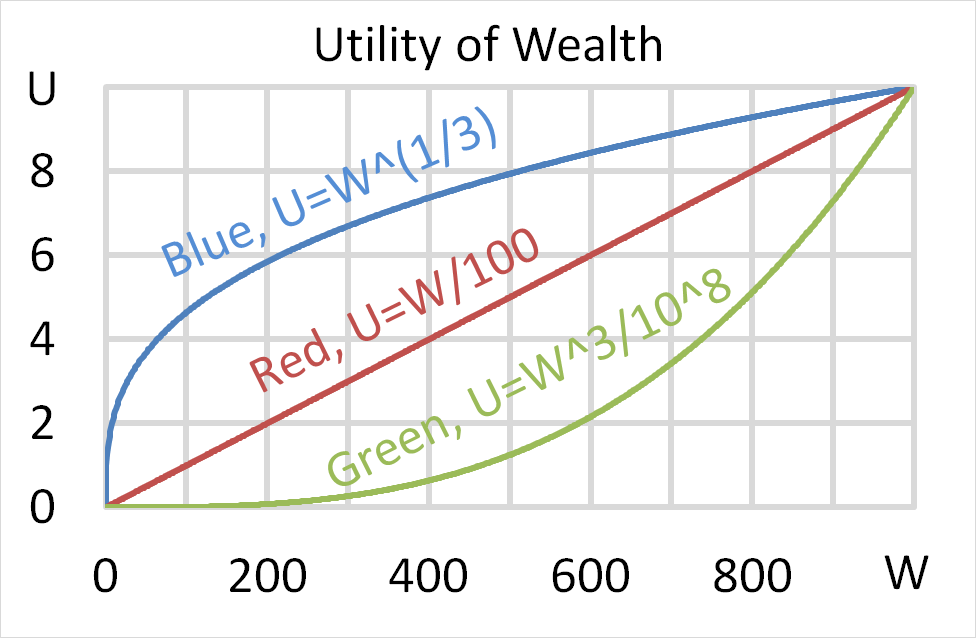
Question 703 utility, risk aversion, utility function, gamble
Mr Blue, Miss Red and Mrs Green are people with different utility functions.
Each person has $500 of initial wealth. A coin toss game is offered to each person at a casino where the player can win or lose $500. Each player can flip a coin and if they flip heads, they receive $500. If they flip tails then they will lose $500. Which of the following statements is NOT correct?
An effective monthly return of 1% ##(r_\text{eff monthly})## is equivalent to an effective annual return ##(r_\text{eff annual})## of:
"Buy low, sell high" is a well-known saying. It suggests that investors should buy low then sell high, in that order.
How would you re-phrase that saying to describe short selling?
Question 948 VaR, expected shortfall
Below is a historical sample of returns on the S&P500 capital index.
| S&P500 Capital Index Daily Returns Ranked from Best to Worst |
||
| 10,000 trading days from 4th August 1977 to 24 March 2017 based on closing prices. |
||
| Rank | Date (DD-MM-YY) |
Continuously compounded daily return (% per day) |
| 1 | 21-10-87 | 9.23 |
| 2 | 08-03-83 | 8.97 |
| 3 | 13-11-08 | 8.3 |
| 4 | 30-09-08 | 8.09 |
| 5 | 28-10-08 | 8.01 |
| 6 | 29-10-87 | 7.28 |
| … | … | … |
| 9980 | 11-12-08 | -5.51 |
| 9981 | 22-10-08 | -5.51 |
| 9982 | 08-08-11 | -5.54 |
| 9983 | 22-09-08 | -5.64 |
| 9984 | 11-09-86 | -5.69 |
| 9985 | 30-11-87 | -5.88 |
| 9986 | 14-04-00 | -5.99 |
| 9987 | 07-10-98 | -6.06 |
| 9988 | 08-01-88 | -6.51 |
| 9989 | 27-10-97 | -6.55 |
| 9990 | 13-10-89 | -6.62 |
| 9991 | 15-10-08 | -6.71 |
| 9992 | 29-09-08 | -6.85 |
| 9993 | 07-10-08 | -6.91 |
| 9994 | 14-11-08 | -7.64 |
| 9995 | 01-12-08 | -7.79 |
| 9996 | 29-10-08 | -8.05 |
| 9997 | 26-10-87 | -8.4 |
| 9998 | 31-08-98 | -8.45 |
| 9999 | 09-10-08 | -12.9 |
| 10000 | 19-10-87 | -23.36 |
| Mean of all 10,000: | 0.0354 | |
| Sample standard deviation of all 10,000: | 1.2062 | |
| Sources: Bloomberg and S&P. | ||
Assume that the one-tail Z-statistic corresponding to a probability of 99.9% is exactly 3.09. Which of the following statements is NOT correct? Based on the historical data, the 99.9% daily:
A stock's returns are normally distributed with a mean of 8% pa and a standard deviation of 15 percentage points pa. What is the 99% confidence interval of returns over the next year? Note that the Z-statistic corresponding to a one-tail:
- 90% normal probability density function is 1.282.
- 95% normal probability density function is 1.645.
- 97.5% normal probability density function is 1.960.
- 99% normal probability density function is 2.326.
- 99.5% normal probability density function is 2.576
The 99% confidence interval of annual returns is between: