| Portfolio Details | ||||||
| Stock | Expected return |
Standard deviation |
Correlation | Beta | Dollars invested |
|
| A | 0.2 | 0.4 | 0.12 | 0.5 | 40 | |
| B | 0.3 | 0.8 | 1.5 | 80 | ||
What is the beta of the above portfolio?
According to the theory of the Capital Asset Pricing Model (CAPM), total variance can be broken into two components, systematic variance and idiosyncratic variance. Which of the following events would be considered the most diversifiable according to the theory of the CAPM?
You just bought $100,000 worth of inventory from a wholesale supplier. You are given the option of paying within 5 days and receiving a 2% discount, or paying the full price within 60 days.
You actually don't have the cash to pay within 5 days, but you could borrow it from the bank (as an overdraft) at 10% pa, given as an effective annual rate.
In 60 days you will have enough money to pay the full cost without having to borrow from the bank.
What is the implicit interest rate charged by the wholesale supplier, given as an effective annual rate? Also, should you borrow from the bank in 5 days to pay the supplier and receive the discount? Or just pay the full price on the last possible date?
Assume that there are 365 days per year.
Which one of the following will have no effect on net income (NI) but decrease cash flow from assets (CFFA or FFCF) in this year for a tax-paying firm, all else remaining constant?
Remember:
###NI=(Rev-COGS-FC-Depr-IntExp).(1-t_c )### ###CFFA=NI+Depr-CapEx - ΔNWC+IntExp###Question 418 capital budgeting, NPV, interest tax shield, WACC, CFFA, CAPM
| Project Data | ||
| Project life | 1 year | |
| Initial investment in equipment | $8m | |
| Depreciation of equipment per year | $8m | |
| Expected sale price of equipment at end of project | 0 | |
| Unit sales per year | 4m | |
| Sale price per unit | $10 | |
| Variable cost per unit | $5 | |
| Fixed costs per year, paid at the end of each year | $2m | |
| Interest expense in first year (at t=1) | $0.562m | |
| Corporate tax rate | 30% | |
| Government treasury bond yield | 5% | |
| Bank loan debt yield | 9% | |
| Market portfolio return | 10% | |
| Covariance of levered equity returns with market | 0.32 | |
| Variance of market portfolio returns | 0.16 | |
| Firm's and project's debt-to-equity ratio | 50% | |
Notes
- Due to the project, current assets will increase by $6m now (t=0) and fall by $6m at the end (t=1). Current liabilities will not be affected.
Assumptions
- The debt-to-equity ratio will be kept constant throughout the life of the project. The amount of interest expense at the end of each period has been correctly calculated to maintain this constant debt-to-equity ratio.
- Millions are represented by 'm'.
- All cash flows occur at the start or end of the year as appropriate, not in the middle or throughout the year.
- All rates and cash flows are real. The inflation rate is 2% pa. All rates are given as effective annual rates.
- The project is undertaken by a firm, not an individual.
What is the net present value (NPV) of the project?
Below are some statements about loans and bonds. The first descriptive sentence is correct. But one of the second sentences about the loans' or bonds' prices is not correct. Which statement is NOT correct? Assume that interest rates are positive.
Note that coupons or interest payments are the periodic payments made throughout a bond or loan's life. The face or par value of a bond or loan is the amount paid at the end when the debt matures.
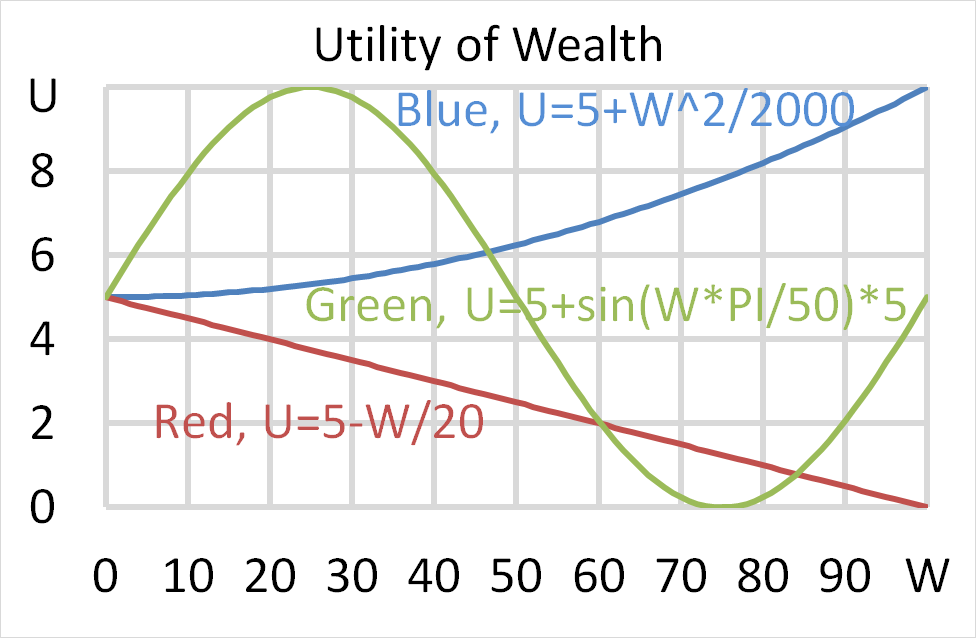
Mr Blue, Miss Red and Mrs Green are people with different utility functions. Which of the statements about the 3 utility functions is NOT correct?
Question 823 option, option payoff at maturity, option profit, no explanation
A European call option should only be exercised if:
Question 915 price gains and returns over time, IRR, NPV, income and capital returns, effective return
For a share price to double over 7 years, what must its capital return be as an effective annual rate?
Question 948 VaR, expected shortfall
Below is a historical sample of returns on the S&P500 capital index.
| S&P500 Capital Index Daily Returns Ranked from Best to Worst |
||
| 10,000 trading days from 4th August 1977 to 24 March 2017 based on closing prices. |
||
| Rank | Date (DD-MM-YY) |
Continuously compounded daily return (% per day) |
| 1 | 21-10-87 | 9.23 |
| 2 | 08-03-83 | 8.97 |
| 3 | 13-11-08 | 8.3 |
| 4 | 30-09-08 | 8.09 |
| 5 | 28-10-08 | 8.01 |
| 6 | 29-10-87 | 7.28 |
| … | … | … |
| 9980 | 11-12-08 | -5.51 |
| 9981 | 22-10-08 | -5.51 |
| 9982 | 08-08-11 | -5.54 |
| 9983 | 22-09-08 | -5.64 |
| 9984 | 11-09-86 | -5.69 |
| 9985 | 30-11-87 | -5.88 |
| 9986 | 14-04-00 | -5.99 |
| 9987 | 07-10-98 | -6.06 |
| 9988 | 08-01-88 | -6.51 |
| 9989 | 27-10-97 | -6.55 |
| 9990 | 13-10-89 | -6.62 |
| 9991 | 15-10-08 | -6.71 |
| 9992 | 29-09-08 | -6.85 |
| 9993 | 07-10-08 | -6.91 |
| 9994 | 14-11-08 | -7.64 |
| 9995 | 01-12-08 | -7.79 |
| 9996 | 29-10-08 | -8.05 |
| 9997 | 26-10-87 | -8.4 |
| 9998 | 31-08-98 | -8.45 |
| 9999 | 09-10-08 | -12.9 |
| 10000 | 19-10-87 | -23.36 |
| Mean of all 10,000: | 0.0354 | |
| Sample standard deviation of all 10,000: | 1.2062 | |
| Sources: Bloomberg and S&P. | ||
Assume that the one-tail Z-statistic corresponding to a probability of 99.9% is exactly 3.09. Which of the following statements is NOT correct? Based on the historical data, the 99.9% daily: