Question 1052 monetary policy, equilibrium real interest rate, marginal propensity to consume, gross domestic product, bond pricing
In the below chart by Rachel and Summers (2019), the red dotted line depicts the decline in advanced economies’ (AE) equilibrium real interest rate (R*) in percentage points since the 1970’s. The authors attribute this to the factors represented by columns above and below the x-axis. The sum of these columns is given by the black line labelled 'Total response of R* in the GE (general equilibrium) models'.
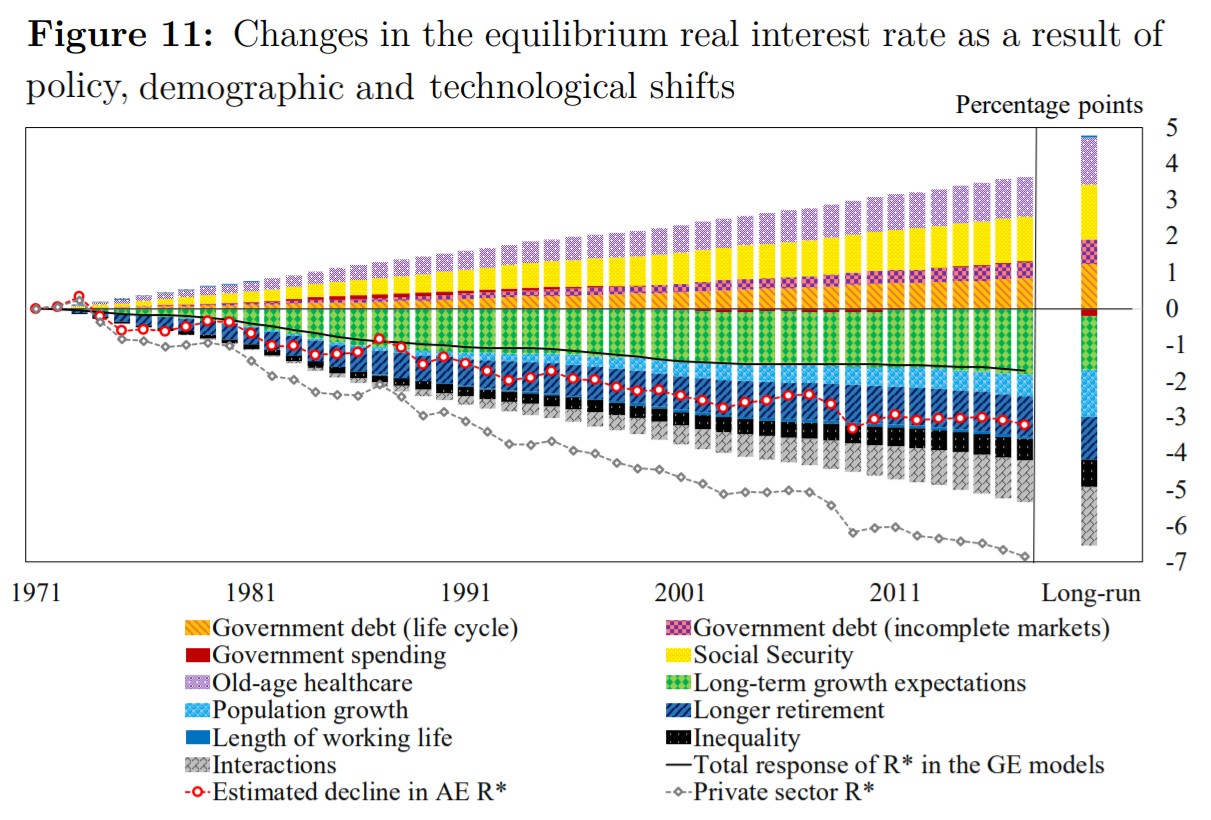
Which of the below statements about this graph is NOT correct?