Calculate Australia’s GDP over the 2016 calendar year using the below table:
| Australian Gross Domestic Product Components | ||||
| A$ billion, 2016 Calendar Year from 1 Jan 2016 to 31 Dec 2016 inclusive | ||||
| Consumption | Investment | Government spending | Exports | Imports |
| 971 | 421 | 320 | 328 | 344 |
Source: ABS 5206.0 Australian National Accounts: National Income, Expenditure and Product. Table 3. Expenditure on Gross Domestic Product (GDP), Current prices.
Over the 2016 calendar year, Australia’s GDP was:
Question 841 gross domestic product, government spending
The government spends money on:
- Goods and services such as defence, police, schools, hospitals and roads; and
- Transfer payments (also called welfare) such as the pension, dole, disability support and student support.
When calculating GDP (=C+I+G+X-M), the ‘government spending’ component (G) is supposed to include:
Question 850 gross domestic product, gross domestic product per capita
Below is a table showing some countries’ GDP, population and GDP per capita.
| Countries' GDP and Population 31 December 2016 |
|||
| GDP, annual | Population | GDP per capita | |
| USD million | millions of people | USD | |
| United States | 18,036,648 | 325 | 55,492 |
| China | 11,158,457 | 1,383 | 8,066 |
| Japan | 4,383,076 | 127 | 34,586 |
| Germany | 3,363,600 | 83 | 40,623 |
| Norway | 500,519 | 5 | 95,027 |
Source: "GDP and its breakdown at current prices in US Dollars" United Nations Statistics Division. December 2016.
Using this data only, which one of these countries’ citizens have the highest living standards?
Question 852 gross domestic product, inflation, employment, no explanation
When the economy is booming (in an upswing), you tend to see:
Which form of production is included in the Gross Domestic Product (GDP) reported by the government statistics agency?
What effect is being referred to in the following quote from the MARTIN model description?
Economy-wide models also account for feedback between economic variables. For example, an increase in aggregate demand will encourage firms to hire more workers, which raises employment and lowers the unemployment rate. The tightening of the labour market is likely to lead to an increase in wages growth. The resulting increase in household incomes is likely to lead to an increase in consumption, further raising aggregate demand. (Ballantyne et al, 2019)
The name of the effect being referred to is:
Question 1039 gross domestic product, inflation, business cycle
In this business cycle graph shown in the RBA's article explaining recessions, how might 'output' on the y-axis be measured?
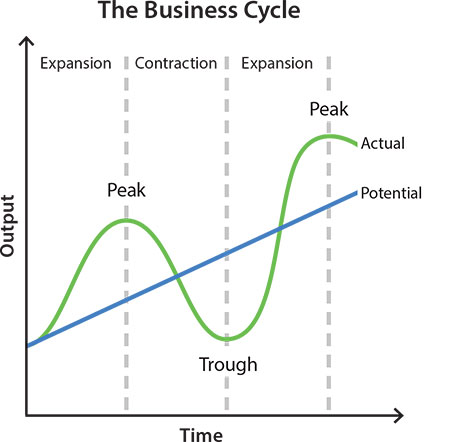
The ‘output’ y-axis amount in the business cycle chart can be measured by:
Question 1051 monetary policy, equilibrium real interest rate, inequality, marginal propensity to consume, gross domestic product, bond pricing
Read the below quote for background, or skip it to answer the question immediately.
In his 31 August 2021 article 'The rich get richer and rates get lower', Robert Armstrong states that:
"Atif Mian, Ludwig Straub and Amir Sufi agree with partisans of the demographic view, such as the economists Charles Goodhart and Manoj Pradhan, that a key contributor to falling rates is higher savings.
Mian, Straub and Sufi disagree, however, about why there are ever more savings sloshing around. It is not because the huge baby-boom generation is getting older and saving more (a trend that will change direction soon, when they are all retired). Rather, it’s because a larger and larger slice of national income is going to the top decile of earners. Because a person can only consume so much, the wealthy few tend to save much of this income rather than spend it. This pushes rates down directly, when those savings are invested, driving asset prices up and yields down; and indirectly, by sapping aggregate demand.
Why doesn’t all the cash that the rich push into markets get converted, ultimately, into productive investment, either at home or abroad? Tricky question. For present purposes it is enough to note that this is not happening — the savings of the American rich reappear, instead, as debt, owed by the government or by lower-income US households. (In another paper, MS&S have pointed out that this means the high share of income going to the rich hurts aggregate demand in two ways: the rich have a lower marginal propensity to consume, and governments and the non-rich are forced to shift dollars from consumption to debt service. Economically speaking, high inequality is a real buzzkill.)
MS&S prefer the inequality explanation for two reasons. Using data from the Fed’s Survey of Consumer Finances (which goes back to 1950) they show that differences in savings rates are much greater within any given age cohort than across age cohorts. That is, savings are building up faster because the rich are getting richer, not because the baby boomers are getting older."
Which of the following statements about this quote is NOT correct?
Question 1052 monetary policy, equilibrium real interest rate, marginal propensity to consume, gross domestic product, bond pricing
In the below chart by Rachel and Summers (2019), the red dotted line depicts the decline in advanced economies’ (AE) equilibrium real interest rate (R*) in percentage points since the 1970’s. The authors attribute this to the factors represented by columns above and below the x-axis. The sum of these columns is given by the black line labelled 'Total response of R* in the GE (general equilibrium) models'.
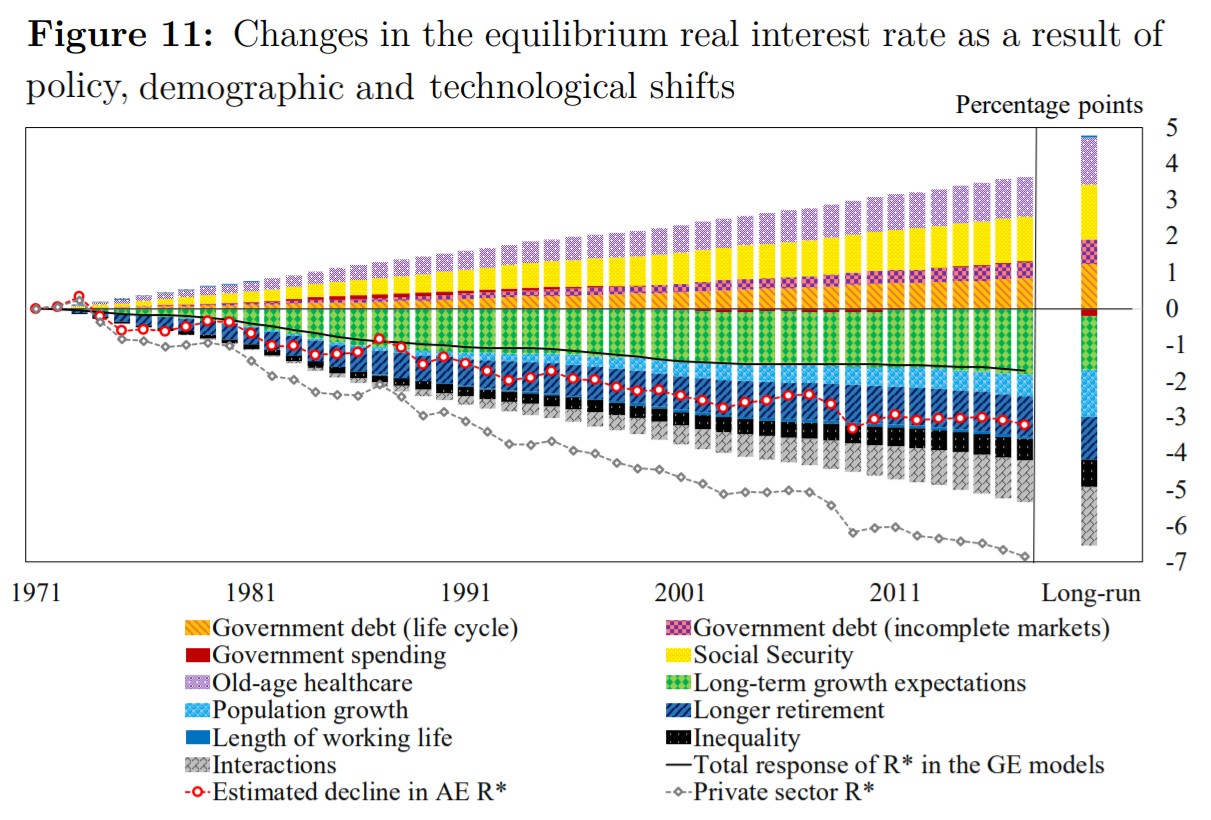
Which of the below statements about this graph is NOT correct?