Calculate the effective annual rates of the following three APR's:
- A credit card offering an interest rate of 18% pa, compounding monthly.
- A bond offering a yield of 6% pa, compounding semi-annually.
- An annual dividend-paying stock offering a return of 10% pa compounding annually.
All answers are given in the same order:
##r_\text{credit card, eff yrly}##, ##r_\text{bond, eff yrly}##, ##r_\text{stock, eff yrly}##
A share just paid its semi-annual dividend of $10. The dividend is expected to grow at 2% every 6 months forever. This 2% growth rate is an effective 6 month rate. Therefore the next dividend will be $10.20 in six months. The required return of the stock 10% pa, given as an effective annual rate.
What is the price of the share now?
You just signed up for a 30 year fully amortising mortgage with monthly payments of $1,000 per month. The interest rate is 6% pa which is not expected to change.
How much did you borrow? After 20 years, how much will be owing on the mortgage? The interest rate is still 6% and is not expected to change.
Acquirer firm plans to launch a takeover of Target firm. The deal is expected to create a present value of synergies totaling $105 million. A scrip offer will be made that pays the fair price for the target's shares plus 75% of the total synergy value.
| Firms Involved in the Takeover | ||
| Acquirer | Target | |
| Assets ($m) | 6,000 | 700 |
| Debt ($m) | 4,800 | 400 |
| Share price ($) | 40 | 20 |
| Number of shares (m) | 30 | 15 |
Ignore transaction costs and fees. Assume that the firms' debt and equity are fairly priced, and that each firms' debts' risk, yield and values remain constant. The acquisition is planned to occur immediately, so ignore the time value of money.
Calculate the merged firm's share price and total number of shares after the takeover has been completed.
The below screenshot of Microsoft's (MSFT) details were taken from the Google Finance website on 28 Nov 2014. Some information has been deliberately blanked out.
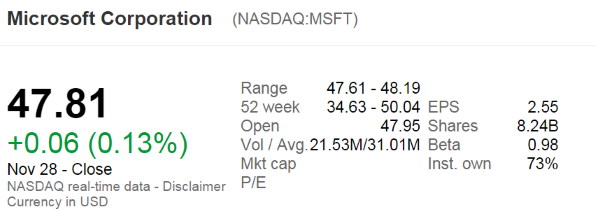
What was MSFT's approximate payout ratio over the last year?
Note that MSFT's past four quarterly dividends were $0.31, $0.28, $0.28 and $0.28.
Alice, Bob, Chris and Delta are traders in the futures market. The following trades occur over a single day in a newly-opened equity index future that matures in one year which the exchange just made available.
1. Alice buys a future from Bob.
2. Chris buys a future from Delta.
3. Delta buys a future from Alice.
These were the only trades made in this equity index future. What was the trading volume and what is the open interest?
Question 779 mean and median returns, return distribution, arithmetic and geometric averages, continuously compounding rate
Fred owns some BHP shares. He has calculated BHP’s monthly returns for each month in the past 30 years using this formula:
###r_\text{t monthly}=\ln \left( \dfrac{P_t}{P_{t-1}} \right)###He then took the arithmetic average and found it to be 0.8% per month using this formula:
###\bar{r}_\text{monthly}= \dfrac{ \displaystyle\sum\limits_{t=1}^T{\left( r_\text{t monthly} \right)} }{T} =0.008=0.8\% \text{ per month}###He also found the standard deviation of these monthly returns which was 15% per month:
###\sigma_\text{monthly} = \dfrac{ \displaystyle\sum\limits_{t=1}^T{\left( \left( r_\text{t monthly} - \bar{r}_\text{monthly} \right)^2 \right)} }{T} =0.15=15\%\text{ per month}###Assume that the past historical average return is the true population average of future expected returns and the stock's returns calculated above ##(r_\text{t monthly})## are normally distributed. Which of the below statements about Fred’s BHP shares is NOT correct?
Below is the Australian federal government’s budget balance as a percent of GDP. Note that the columns to the right of the vertical black line were a forecast at the time. The x-axis shows financial years, so for example the 06/07 financial year represents the time period from 1 July 2006 to 30 June 2007.
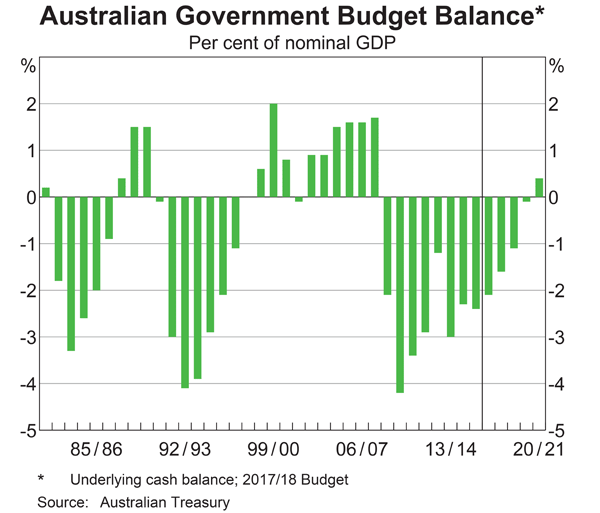
Comparing the 2008/09 financial year to the previous one, the Australian federal government implemented:
Which of the following is NOT the Australian central bank’s responsibility?