Find World Bar's Cash Flow From Assets (CFFA), also known as Free Cash Flow to the Firm (FCFF), over the year ending 30th June 2013.
| World Bar | ||
| Income Statement for | ||
| year ending 30th June 2013 | ||
| $m | ||
| Sales | 300 | |
| COGS | 150 | |
| Operating expense | 50 | |
| Depreciation | 40 | |
| Interest expense | 10 | |
| Taxable income | 50 | |
| Tax at 30% | 15 | |
| Net income | 35 | |
| World Bar | ||
| Balance Sheet | ||
| as at 30th June | 2013 | 2012 |
| $m | $m | |
| Assets | ||
| Current assets | 200 | 230 |
| PPE | ||
| Cost | 400 | 400 |
| Accumul. depr. | 75 | 35 |
| Carrying amount | 325 | 365 |
| Total assets | 525 | 595 |
| Liabilities | ||
| Current liabilities | 150 | 205 |
| Non-current liabilities | 235 | 250 |
| Owners' equity | ||
| Retained earnings | 100 | 100 |
| Contributed equity | 40 | 40 |
| Total L and OE | 525 | 595 |
Note: all figures above and below are given in millions of dollars ($m).
Stocks in the United States usually pay quarterly dividends. For example, the retailer Wal-Mart Stores paid a $0.47 dividend every quarter over the 2013 calendar year and plans to pay a $0.48 dividend every quarter over the 2014 calendar year.
Using the dividend discount model and net present value techniques, calculate the stock price of Wal-Mart Stores assuming that:
- The time now is the beginning of January 2014. The next dividend of $0.48 will be received in 3 months (end of March 2014), with another 3 quarterly payments of $0.48 after this (end of June, September and December 2014).
- The quarterly dividend will increase by 2% every year, but each quarterly dividend over the year will be equal. So each quarterly dividend paid in 2015 will be $0.4896 (##=0.48×(1+0.02)^1##), with the first at the end of March 2015 and the last at the end of December 2015. In 2016 each quarterly dividend will be $0.499392 (##=0.48×(1+0.02)^2##), with the first at the end of March 2016 and the last at the end of December 2016, and so on forever.
- The total required return on equity is 6% pa.
- The required return and growth rate are given as effective annual rates.
- All cash flows and rates are nominal. Inflation is 3% pa.
- Dividend payment dates and ex-dividend dates are at the same time.
- Remember that there are 4 quarters in a year and 3 months in a quarter.
What is the current stock price?
A firm plans to issue equity and use the cash raised to pay off its debt. No assets will be bought or sold. Ignore the costs of financial distress.
Which of the following statements is NOT correct, all things remaining equal?
An American wishes to convert USD 1 million to Australian dollars (AUD). The exchange rate is 0.8 USD per AUD. How much is the USD 1 million worth in AUD?
A trader buys one crude oil European style call option contract on the CME expiring in one year with an exercise price of $44 per barrel for a price of $6.64. The crude oil spot price is $40.33. If the trader doesn’t close out her contract before maturity, then at maturity she will have the:
Question 778 CML, systematic and idiosyncratic risk, portfolio risk, CAPM
The capital market line (CML) is shown in the graph below. The total standard deviation is denoted by σ and the expected return is μ. Assume that markets are efficient so all assets are fairly priced.
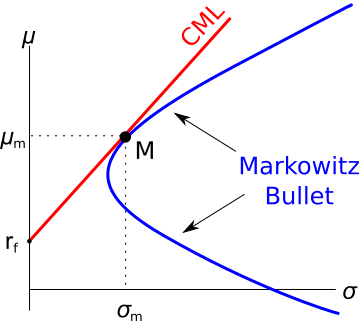
Which of the below statements is NOT correct?
The following steps outline the process of ‘negative gearing’ an investment property in Australia. Which of these steps or statements is NOT correct? To successfully achieve negative gearing on an investment property:
Examine the graph of the AUD versus the USD, EUR and JPY. Note that RHS means right hand side and LHS left hand side which indicates which axis each line corresponds to. Assume inflation rates in each country were equal over the time period 1984 to 2018.
Which of the following statements is NOT correct?
Question 920 SML, CAPM, Sharpe ratio, Treynor ratio, Jensens alpha, no explanation
Over-priced assets should NOT: