Question 49 inflation, real and nominal returns and cash flows, APR, effective rate
In Australia, nominal yields on semi-annual coupon paying Government Bonds with 2 years until maturity are currently 2.83% pa.
The inflation rate is currently 2.2% pa, given as an APR compounding per quarter. The inflation rate is not expected to change over the next 2 years.
What is the real yield on these bonds, given as an APR compounding every 6 months?
When using the dividend discount model to price a stock:
### p_{0} = \frac{d_1}{r - g} ###
The growth rate of dividends (g):
A share pays annual dividends. It just paid a dividend of $2. The growth rate in the dividend is 3% pa. You estimate that the stock's required return is 8% pa. Both the discount rate and growth rate are given as effective annual rates.
Using the dividend discount model, what is the share price?
The following is the Dividend Discount Model (DDM) used to price stocks:
###P_0=\dfrac{C_1}{r-g}###
If the assumptions of the DDM hold and the stock is fairly priced, which one of the following statements is NOT correct? The long term expected:
Stocks in the United States usually pay quarterly dividends. For example, the retailer Wal-Mart Stores paid a $0.47 dividend every quarter over the 2013 calendar year and plans to pay a $0.48 dividend every quarter over the 2014 calendar year.
Using the dividend discount model and net present value techniques, calculate the stock price of Wal-Mart Stores assuming that:
- The time now is the beginning of January 2014. The next dividend of $0.48 will be received in 3 months (end of March 2014), with another 3 quarterly payments of $0.48 after this (end of June, September and December 2014).
- The quarterly dividend will increase by 2% every year, but each quarterly dividend over the year will be equal. So each quarterly dividend paid in 2015 will be $0.4896 (##=0.48×(1+0.02)^1##), with the first at the end of March 2015 and the last at the end of December 2015. In 2016 each quarterly dividend will be $0.499392 (##=0.48×(1+0.02)^2##), with the first at the end of March 2016 and the last at the end of December 2016, and so on forever.
- The total required return on equity is 6% pa.
- The required return and growth rate are given as effective annual rates.
- All cash flows and rates are nominal. Inflation is 3% pa.
- Dividend payment dates and ex-dividend dates are at the same time.
- Remember that there are 4 quarters in a year and 3 months in a quarter.
What is the current stock price?
Which of the following companies is most suitable for valuation using PE multiples techniques?
The below three graphs show probability density functions (PDF) of three different random variables Red, Green and Blue. Let ##P_1## be the unknown price of a stock in one year. ##P_1## is a random variable. Let ##P_0 = 1##, so the share price now is $1. This one dollar is a constant, it is not a variable.
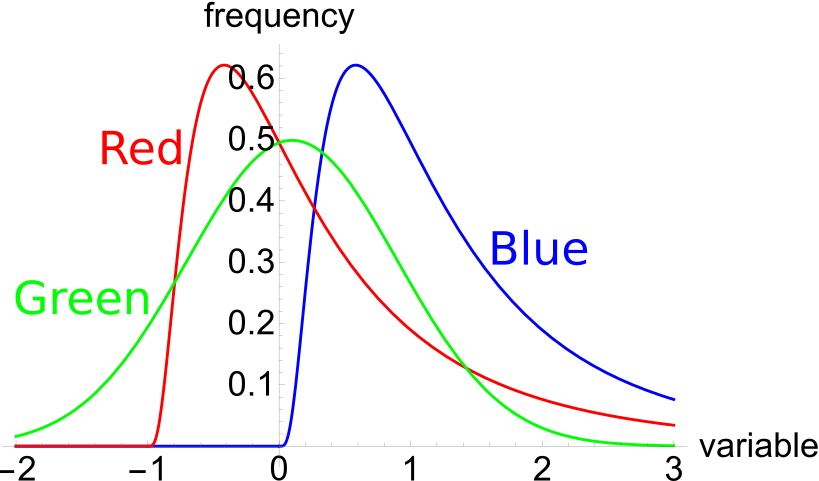
Which of the below statements is NOT correct? Financial practitioners commonly assume that the shape of the PDF represented in the colour:
Question 721 mean and median returns, return distribution, arithmetic and geometric averages, continuously compounding rate
Fred owns some Commonwealth Bank (CBA) shares. He has calculated CBA’s monthly returns for each month in the past 20 years using this formula:
###r_\text{t monthly}=\ln \left( \dfrac{P_t}{P_{t-1}} \right)###He then took the arithmetic average and found it to be 1% per month using this formula:
###\bar{r}_\text{monthly}= \dfrac{ \displaystyle\sum\limits_{t=1}^T{\left( r_\text{t monthly} \right)} }{T} =0.01=1\% \text{ per month}###He also found the standard deviation of these monthly returns which was 5% per month:
###\sigma_\text{monthly} = \dfrac{ \displaystyle\sum\limits_{t=1}^T{\left( \left( r_\text{t monthly} - \bar{r}_\text{monthly} \right)^2 \right)} }{T} =0.05=5\%\text{ per month}###Which of the below statements about Fred’s CBA shares is NOT correct? Assume that the past historical average return is the true population average of future expected returns.