Question 58 NPV, inflation, real and nominal returns and cash flows, Annuity
A project to build a toll bridge will take two years to complete, costing three payments of $100 million at the start of each year for the next three years, that is at t=0, 1 and 2.
After completion, the toll bridge will yield a constant $50 million at the end of each year for the next 10 years. So the first payment will be at t=3 and the last at t=12. After the last payment at t=12, the bridge will be given to the government.
The required return of the project is 21% pa given as an effective annual nominal rate.
All cash flows are real and the expected inflation rate is 10% pa given as an effective annual rate. Ignore taxes.
The Net Present Value is:
Diversification is achieved by investing in a large amount of stocks. What type of risk is reduced by diversification?
Question 96 bond pricing, zero coupon bond, term structure of interest rates, forward interest rate
An Australian company just issued two bonds paying semi-annual coupons:
- 1 year zero coupon bond at a yield of 8% pa, and a
- 2 year zero coupon bond at a yield of 10% pa.
What is the forward rate on the company's debt from years 1 to 2? Give your answer as an APR compounding every 6 months, which is how the above bond yields are quoted.
Suppose that the US government recently announced that subsidies for fresh milk producers will be gradually phased out over the next year. Newspapers say that there are expectations of a 40% increase in the spot price of fresh milk over the next year.
Option prices on fresh milk trading on the Chicago Mercantile Exchange (CME) reflect expectations of this 40% increase in spot prices over the next year. Similarly to the rest of the market, you believe that prices will rise by 40% over the next year.
What option trades are likely to be profitable, or to be more specific, result in a positive Net Present Value (NPV)?
Assume that:
- Only the spot price is expected to increase and there is no change in expected volatility or other variables that affect option prices.
- No taxes, transaction costs, information asymmetry, bid-ask spreads or other market frictions.
A new company's Firm Free Cash Flow (FFCF, same as CFFA) is forecast in the graph below.
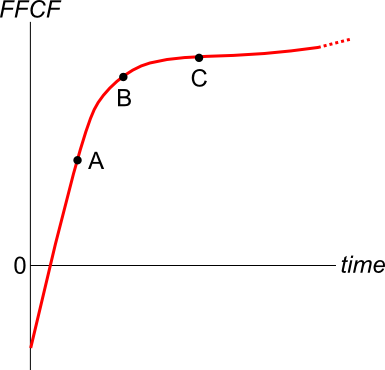
To value the firm's assets, the terminal value needs to be calculated using the perpetuity with growth formula:
###V_{\text{terminal, }t-1} = \dfrac{FFCF_{\text{terminal, }t}}{r-g}###
Which point corresponds to the best time to calculate the terminal value?
Acquirer firm plans to launch a takeover of Target firm. The firms operate in different industries and the CEO's rationale for the merger is to increase diversification and thereby decrease risk. The deal is not expected to create any synergies. An 80% scrip and 20% cash offer will be made that pays the fair price for the target's shares. The cash will be paid out of the firms' cash holdings, no new debt or equity will be raised.
| Firms Involved in the Takeover | ||
| Acquirer | Target | |
| Assets ($m) | 6,000 | 700 |
| Debt ($m) | 4,800 | 400 |
| Share price ($) | 40 | 20 |
| Number of shares (m) | 30 | 15 |
Ignore transaction costs and fees. Assume that the firms' debt and equity are fairly priced, and that each firms' debts' risk, yield and values remain constant. The acquisition is planned to occur immediately, so ignore the time value of money.
Calculate the merged firm's share price and total number of shares after the takeover has been completed.
Which one of the below statements about effective rates and annualised percentage rates (APR's) is NOT correct?
The below three graphs show probability density functions (PDF) of three different random variables Red, Green and Blue.
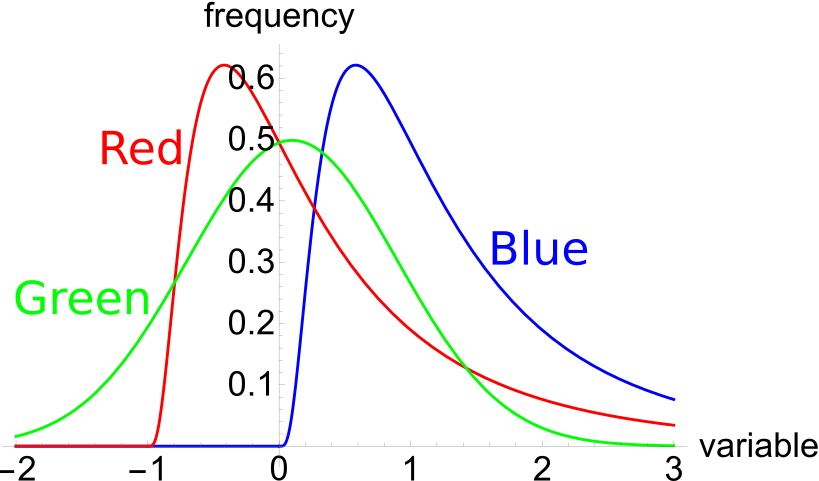
Which of the below statements is NOT correct?