The required return of a project is 10%, given as an effective annual rate.
What is the payback period of the project in years?
Assume that the cash flows shown in the table are received smoothly over the year. So the $121 at time 2 is actually earned smoothly from t=1 to t=2.
| Project Cash Flows | |
| Time (yrs) | Cash flow ($) |
| 0 | -100 |
| 1 | 11 |
| 2 | 121 |
Find Candys Corporation's Cash Flow From Assets (CFFA), also known as Free Cash Flow to the Firm (FCFF), over the year ending 30th June 2013.
| Candys Corp | ||
| Income Statement for | ||
| year ending 30th June 2013 | ||
| $m | ||
| Sales | 200 | |
| COGS | 50 | |
| Operating expense | 10 | |
| Depreciation | 20 | |
| Interest expense | 10 | |
| Income before tax | 110 | |
| Tax at 30% | 33 | |
| Net income | 77 | |
| Candys Corp | ||
| Balance Sheet | ||
| as at 30th June | 2013 | 2012 |
| $m | $m | |
| Assets | ||
| Current assets | 220 | 180 |
| PPE | ||
| Cost | 300 | 340 |
| Accumul. depr. | 60 | 40 |
| Carrying amount | 240 | 300 |
| Total assets | 460 | 480 |
| Liabilities | ||
| Current liabilities | 175 | 190 |
| Non-current liabilities | 135 | 130 |
| Owners' equity | ||
| Retained earnings | 50 | 60 |
| Contributed equity | 100 | 100 |
| Total L and OE | 460 | 480 |
Note: all figures are given in millions of dollars ($m).
Discounted cash flow (DCF) valuation prices assets by finding the present value of the asset's future cash flows. The single cash flow, annuity, and perpetuity equations are very useful for this.
Which of the following equations is the 'perpetuity with growth' equation?
The perpetuity with growth formula, also known as the dividend discount model (DDM) or Gordon growth model, is appropriate for valuing a company's shares. ##P_0## is the current share price, ##C_1## is next year's expected dividend, ##r## is the total required return and ##g## is the expected growth rate of the dividend.
###P_0=\dfrac{C_1}{r-g}###
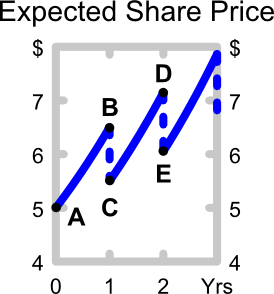
The below graph shows the expected future price path of the company's shares. Which of the following statements about the graph is NOT correct?
Question 638 option, option payoff at maturity, no explanation
Which of the below formulas gives the payoff ##(f)## at maturity ##(T)## from being long a put option? Let the underlying asset price at maturity be ##S_T## and the exercise price be ##X_T##.
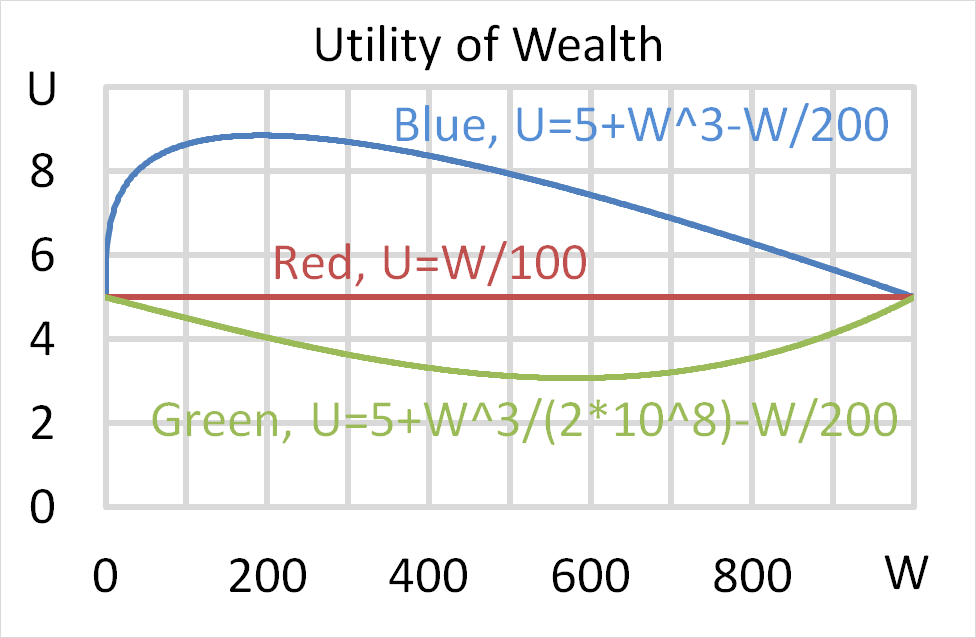
Mr Blue, Miss Red and Mrs Green are people with different utility functions.
Which of the following statements is NOT correct?
Question 719 mean and median returns, return distribution, arithmetic and geometric averages, continuously compounding rate
A stock has an arithmetic average continuously compounded return (AALGDR) of 10% pa, a standard deviation of continuously compounded returns (SDLGDR) of 80% pa and current stock price of $1. Assume that stock prices are log-normally distributed. The graph below summarises this information and provides some helpful formulas.
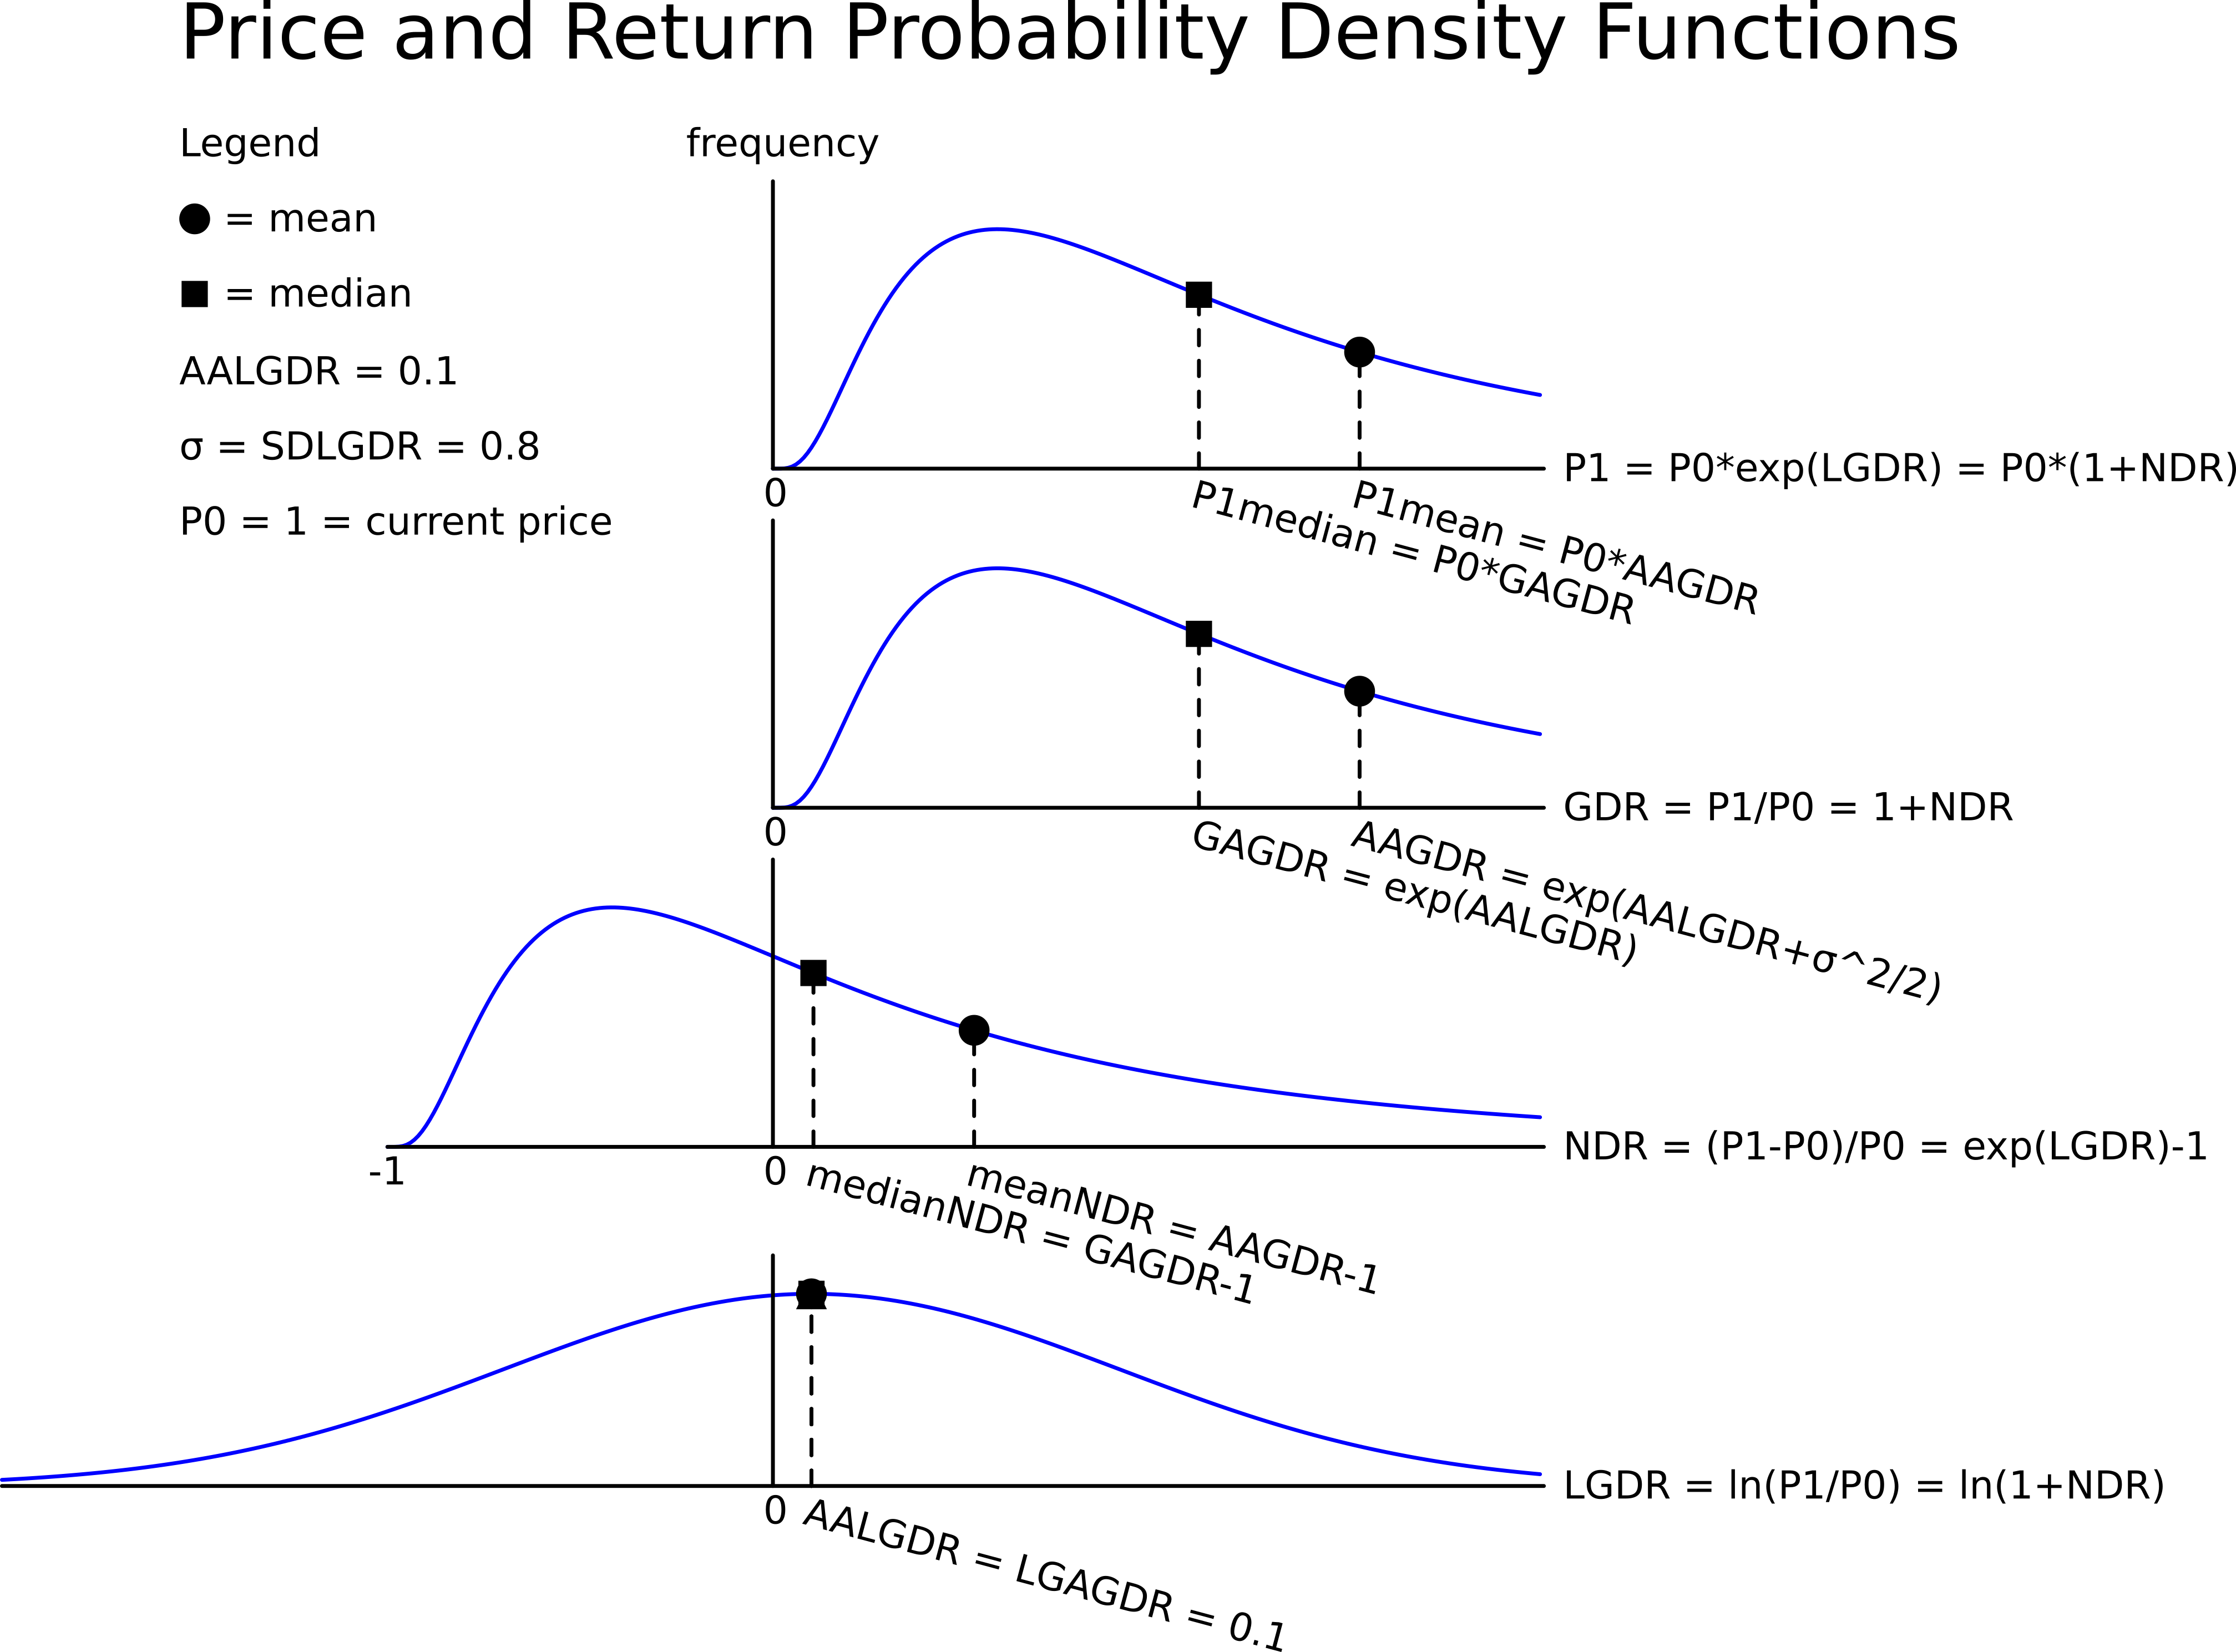
In one year, what do you expect the median and mean prices to be? The answer options are given in the same order.
Question 875 omitted variable bias, systematic and idiosyncratic risk, CAPM, single factor model, two factor model
The Capital Asset Pricing Model (CAPM) and the Single Index Model (SIM) are single factor models whose only risk factor is the market portfolio’s return. Say a Solar electricity generator company and a Beach bathing chair renting company are influenced by two factors, the market portfolio return and cloud cover in the sky. When it's sunny and not cloudy, both the Solar and Beach companies’ stock prices do well. When there’s dense cloud cover and no sun, both do poorly. Assume that cloud coverage risk is a systematic risk that cannot be diversified and that cloud cover has zero correlation with the market portfolio’s returns.
Which of the following statements about these two stocks is NOT correct?
The CAPM and SIM:
Examine the below graph.
Which of the below statements is NOT correct?