The equations for Net Income (NI, also known as Earnings or Net Profit After Tax) and Cash Flow From Assets (CFFA, also known as Free Cash Flow to the Firm) per year are:
###NI=(Rev-COGS-FC-Depr-IntExp).(1-t_c)###
###CFFA=NI+Depr-CapEx - \varDelta NWC+IntExp###
For a firm with debt, what is the formula for the present value of interest tax shields if the tax shields occur in perpetuity?
You may assume:
- the value of debt (D) is constant through time,
- The cost of debt and the yield on debt are equal and given by ##r_D##.
- the appropriate rate to discount interest tax shields is ##r_D##.
- ##\text{IntExp}=D.r_D##
Harvey Norman the large retailer often runs sales advertising 2 years interest free when you purchase its products. This offer can be seen as a free personal loan from Harvey Norman to its customers.
Assume that banks charge an interest rate on personal loans of 12% pa given as an APR compounding per month. This is the interest rate that Harvey Norman deserves on the 2 year loan it extends to its customers. Therefore Harvey Norman must implicitly include the cost of this loan in the advertised sale price of its goods.
If you were a customer buying from Harvey Norman, and you were paying immediately, not in 2 years, what is the minimum percentage discount to the advertised sale price that you would insist on? (Hint: if it makes it easier, assume that you’re buying a product with an advertised price of $100).
A company's shares just paid their annual dividend of $2 each.
The stock price is now $40 (just after the dividend payment). The annual dividend is expected to grow by 3% every year forever. The assumptions of the dividend discount model are valid for this company.
What do you expect the effective annual dividend yield to be in 3 years (dividend yield from t=3 to t=4)?
Find Sidebar Corporation's Cash Flow From Assets (CFFA), also known as Free Cash Flow to the Firm (FCFF), over the year ending 30th June 2013.
| Sidebar Corp | ||
| Income Statement for | ||
| year ending 30th June 2013 | ||
| $m | ||
| Sales | 405 | |
| COGS | 100 | |
| Depreciation | 34 | |
| Rent expense | 22 | |
| Interest expense | 39 | |
| Taxable Income | 210 | |
| Taxes at 30% | 63 | |
| Net income | 147 | |
| Sidebar Corp | ||
| Balance Sheet | ||
| as at 30th June | 2013 | 2012 |
| $m | $m | |
| Cash | 0 | 0 |
| Inventory | 70 | 50 |
| Trade debtors | 11 | 16 |
| Rent paid in advance | 4 | 3 |
| PPE | 700 | 680 |
| Total assets | 785 | 749 |
| Trade creditors | 11 | 19 |
| Bond liabilities | 400 | 390 |
| Contributed equity | 220 | 220 |
| Retained profits | 154 | 120 |
| Total L and OE | 785 | 749 |
Note: All figures are given in millions of dollars ($m).
The cash flow from assets was:
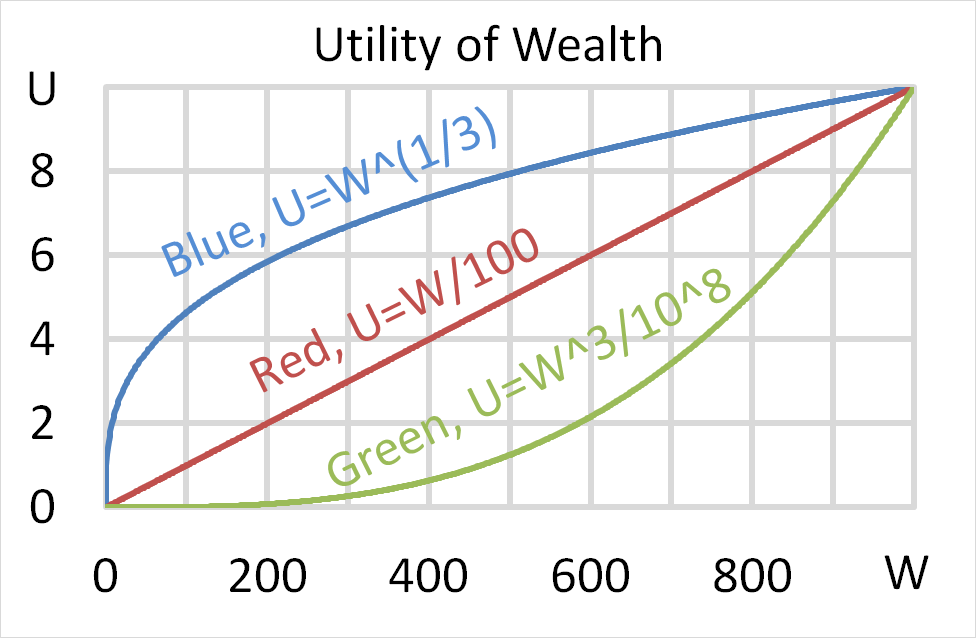
Question 704 utility, risk aversion, utility function, gamble
Mr Blue, Miss Red and Mrs Green are people with different utility functions.
Each person has $256 of initial wealth. A coin toss game is offered to each person at a casino where the player can win or lose $256. Each player can flip a coin and if they flip heads, they receive $256. If they flip tails then they will lose $256. Which of the following statements is NOT correct?
Question 895 comparative advantage in trade, production possibilities curve
Adam and Bella are the only people on a remote island.
Luckily there are Coconut and Date palm trees on the island that grow delicious fruit. The problem is that harvesting the fruit takes a lot of work.
Adam can pick 7 coconuts per hour, 6 dates per hour or any linear combination of coconuts and dates. For example, he could pick 3.5 coconuts and 3 dates per hour.
Bella can pick 3 coconuts per hour, 5 dates per hour or any linear combination. For example, she could pick 1.5 coconuts and 2.5 dates per hour.
This information is summarised in the table and graph:
| Harvest Rates Per Hour | ||
| Coconuts | Dates | |
| Adam | 7 | 6 |
| Bella | 3 | 5 |
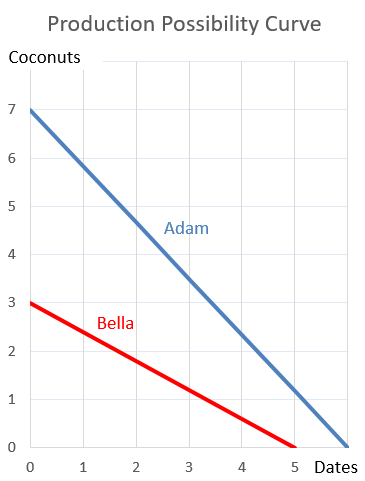
Which of the following statements is NOT correct?
Question 928 mean and median returns, mode return, return distribution, arithmetic and geometric averages, continuously compounding rate, no explanation
The arithmetic average continuously compounded or log gross discrete return (AALGDR) on the ASX200 accumulation index over the 24 years from 31 Dec 1992 to 31 Dec 2016 is 9.49% pa.
The arithmetic standard deviation (SDLGDR) is 16.92 percentage points pa.
Assume that the log gross discrete returns are normally distributed and that the above estimates are true population statistics, not sample statistics, so there is no standard error in the sample mean or standard deviation estimates. Also assume that the standardised normal Z-statistic corresponding to a one-tail probability of 2.5% is exactly -1.96.
If you had a $1 million fund that replicated the ASX200 accumulation index, in how many years would the mode dollar value of your fund first be expected to lie outside the 95% confidence interval forecast?
Note that the mode of a log-normally distributed future price is: ##P_{T \text{ mode}} = P_0.e^{(\text{AALGDR} - \text{SDLGDR}^2 ).T} ##
Which of the following statements about vanilla floating coupon bonds paying quarterly coupons is NOT correct? A vanilla floating coupon bond's: