Find World Bar's Cash Flow From Assets (CFFA), also known as Free Cash Flow to the Firm (FCFF), over the year ending 30th June 2013.
| World Bar | ||
| Income Statement for | ||
| year ending 30th June 2013 | ||
| $m | ||
| Sales | 300 | |
| COGS | 150 | |
| Operating expense | 50 | |
| Depreciation | 40 | |
| Interest expense | 10 | |
| Taxable income | 50 | |
| Tax at 30% | 15 | |
| Net income | 35 | |
| World Bar | ||
| Balance Sheet | ||
| as at 30th June | 2013 | 2012 |
| $m | $m | |
| Assets | ||
| Current assets | 200 | 230 |
| PPE | ||
| Cost | 400 | 400 |
| Accumul. depr. | 75 | 35 |
| Carrying amount | 325 | 365 |
| Total assets | 525 | 595 |
| Liabilities | ||
| Current liabilities | 150 | 205 |
| Non-current liabilities | 235 | 250 |
| Owners' equity | ||
| Retained earnings | 100 | 100 |
| Contributed equity | 40 | 40 |
| Total L and OE | 525 | 595 |
Note: all figures above and below are given in millions of dollars ($m).
Which of the following statements is NOT equivalent to the yield on debt?
Assume that the debt being referred to is fairly priced, but do not assume that it's priced at par.
A European call option will mature in ##T## years with a strike price of ##K## dollars. The underlying asset has a price of ##S## dollars.
What is an expression for the payoff at maturity ##(f_T)## in dollars from owning (being long) the call option?
High risk firms in danger of bankruptcy tend to have:
An equity index is currently at 4,800 points. The 1.5 year futures price is 5,100 points and the total required return is 6% pa with continuous compounding. Each index point is worth $25.
What is the implied dividend yield as a continuously compounded rate per annum?
Question 779 mean and median returns, return distribution, arithmetic and geometric averages, continuously compounding rate
Fred owns some BHP shares. He has calculated BHP’s monthly returns for each month in the past 30 years using this formula:
###r_\text{t monthly}=\ln \left( \dfrac{P_t}{P_{t-1}} \right)###He then took the arithmetic average and found it to be 0.8% per month using this formula:
###\bar{r}_\text{monthly}= \dfrac{ \displaystyle\sum\limits_{t=1}^T{\left( r_\text{t monthly} \right)} }{T} =0.008=0.8\% \text{ per month}###He also found the standard deviation of these monthly returns which was 15% per month:
###\sigma_\text{monthly} = \dfrac{ \displaystyle\sum\limits_{t=1}^T{\left( \left( r_\text{t monthly} - \bar{r}_\text{monthly} \right)^2 \right)} }{T} =0.15=15\%\text{ per month}###Assume that the past historical average return is the true population average of future expected returns and the stock's returns calculated above ##(r_\text{t monthly})## are normally distributed. Which of the below statements about Fred’s BHP shares is NOT correct?
The famous investor Warren Buffett is one of few portfolio managers who appears to have consistently beaten the market. His company Berkshire Hathaway (BRK) appears to have outperformed the US S&P500 market index, shown in the graph below.
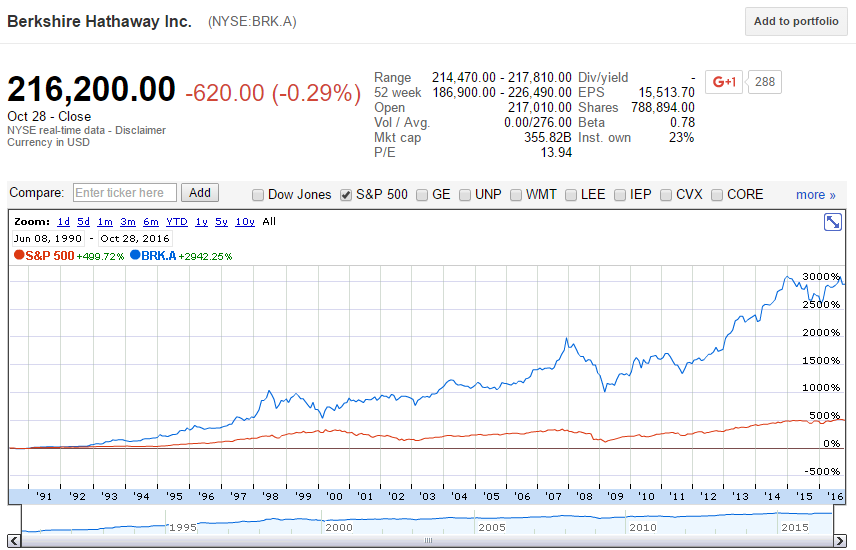
Read the below statements about Warren Buffett and the implications for the Efficient Markets Hypothesis (EMH) theory of Eugene Fama. Assume that the first sentence is true. Analyse the second sentence and select the answer option which is NOT correct. In other words, find the false statement in the second sentence.
Question 925 mean and median returns, return distribution, arithmetic and geometric averages, continuously compounding rate, no explanation
The arithmetic average and standard deviation of returns on the ASX200 accumulation index over the 24 years from 31 Dec 1992 to 31 Dec 2016 were calculated as follows:
###\bar{r}_\text{yearly} = \dfrac{ \displaystyle\sum\limits_{t=1992}^{24}{\left( \ln \left( \dfrac{P_{t+1}}{P_t} \right) \right)} }{T} = \text{AALGDR} =0.0949=9.49\% \text{ pa}###
###\sigma_\text{yearly} = \dfrac{ \displaystyle\sum\limits_{t=1992}^{24}{\left( \left( \ln \left( \dfrac{P_{t+1}}{P_t} \right) - \bar{r}_\text{yearly} \right)^2 \right)} }{T} = \text{SDLGDR} = 0.1692=16.92\text{ pp pa}###
Assume that the log gross discrete returns are normally distributed and that the above estimates are true population statistics, not sample statistics, so there is no standard error in the sample mean or standard deviation estimates. Also assume that the standardised normal Z-statistic corresponding to a one-tail probability of 2.5% is exactly -1.96.
Which of the following statements is NOT correct? If you invested $1m today in the ASX200, then over the next 4 years: