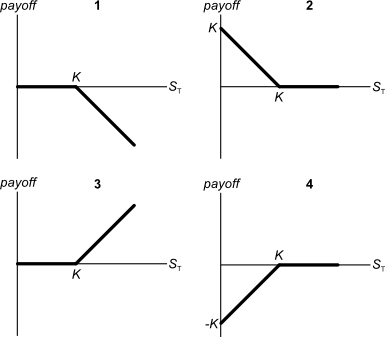
Below are 4 option graphs. Note that the y-axis is payoff at maturity (T). What options do they depict? List them in the order that they are numbered
A project's Profitability Index (PI) is less than 1. Select the most correct statement:
Question 353 income and capital returns, inflation, real and nominal returns and cash flows, real estate
A residential investment property has an expected nominal total return of 6% pa and nominal capital return of 3% pa.
Inflation is expected to be 2% pa. All rates are given as effective annual rates.
What are the property's expected real total, capital and income returns? The answer choices below are given in the same order.
Question 469 franking credit, personal tax on dividends, imputation tax system, no explanation
A firm pays a fully franked cash dividend of $70 to one of its Australian shareholders who has a personal marginal tax rate of 45%. The corporate tax rate is 30%.
What will be the shareholder's personal tax payable due to the dividend payment?
Question 625 dividend re-investment plan, capital raising
Which of the following statements about dividend re-investment plans (DRP's) is NOT correct?
Below is a graph of the USD against the JPY and EUR from 1980 to 2015, compiled by the RBA. Select the correct statement about what occurred between 1980 and 2015. Note that in 1980 the euro was around 1.3 USD per EUR and the Yen was around 250 JPY per USD.
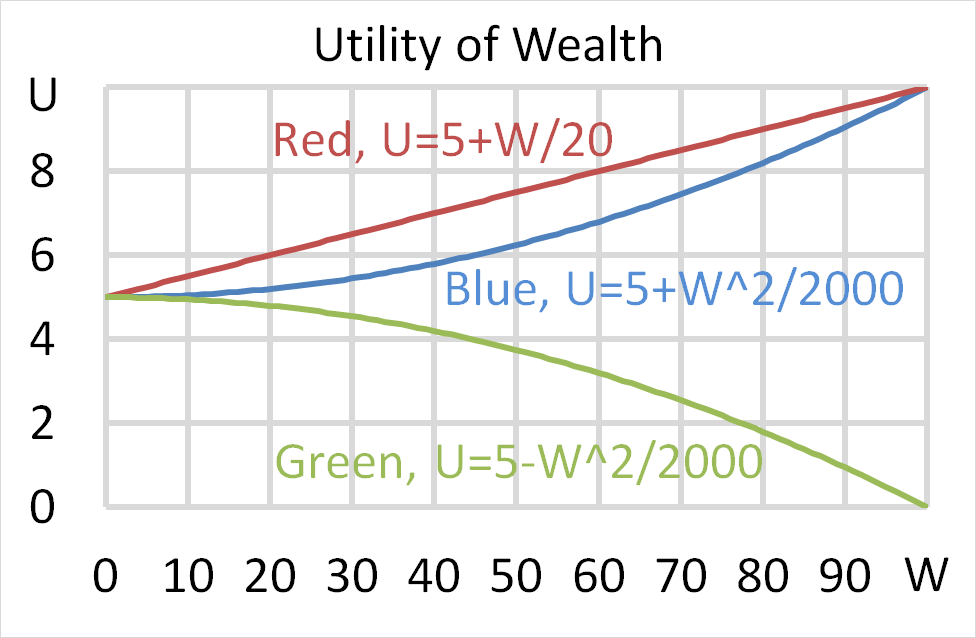
Mr Blue, Miss Red and Mrs Green are people with different utility functions. Which of the statements about the 3 utility functions is NOT correct?
Use the below information to value a levered company with constant annual perpetual cash flows from assets. The next cash flow will be generated in one year from now, so a perpetuity can be used to value this firm. Both the operating and firm free cash flows are constant (but not equal to each other).
| Data on a Levered Firm with Perpetual Cash Flows | ||
| Item abbreviation | Value | Item full name |
| ##\text{OFCF}## | $48.5m | Operating free cash flow |
| ##\text{FFCF or CFFA}## | $50m | Firm free cash flow or cash flow from assets |
| ##g## | 0% pa | Growth rate of OFCF and FFCF |
| ##\text{WACC}_\text{BeforeTax}## | 10% pa | Weighted average cost of capital before tax |
| ##\text{WACC}_\text{AfterTax}## | 9.7% pa | Weighted average cost of capital after tax |
| ##r_\text{D}## | 5% pa | Cost of debt |
| ##r_\text{EL}## | 11.25% pa | Cost of levered equity |
| ##D/V_L## | 20% pa | Debt to assets ratio, where the asset value includes tax shields |
| ##t_c## | 30% | Corporate tax rate |
What is the value of the levered firm including interest tax shields?
Question 926 mean and median returns, return distribution, arithmetic and geometric averages, continuously compounding rate
The arithmetic average continuously compounded or log gross discrete return (AALGDR) on the ASX200 accumulation index over the 24 years from 31 Dec 1992 to 31 Dec 2016 is 9.49% pa.
The arithmetic standard deviation (SDLGDR) is 16.92 percentage points pa.
Assume that the log gross discrete returns are normally distributed and that the above estimates are true population statistics, not sample statistics, so there is no standard error in the sample mean or standard deviation estimates. Also assume that the standardised normal Z-statistic corresponding to a one-tail probability of 2.5% is exactly -1.96.
If you had a $1 million fund that replicated the ASX200 accumulation index, in how many years would the median dollar value of your fund first be expected to lie outside the 95% confidence interval forecast?