A share just paid its semi-annual dividend of $10. The dividend is expected to grow at 2% every 6 months forever. This 2% growth rate is an effective 6 month rate. Therefore the next dividend will be $10.20 in six months. The required return of the stock is 10% pa, given as an effective annual rate.
What is the price of the share now?
Which of the following statements about effective rates and annualised percentage rates (APR's) is NOT correct?
Read the following financial statements and calculate the firm's free cash flow over the 2014 financial year.
| UBar Corp | ||
| Income Statement for | ||
| year ending 30th June 2014 | ||
| $m | ||
| Sales | 293 | |
| COGS | 200 | |
| Rent expense | 15 | |
| Gas expense | 8 | |
| Depreciation | 10 | |
| EBIT | 60 | |
| Interest expense | 0 | |
| Taxable income | 60 | |
| Taxes | 18 | |
| Net income | 42 | |
| UBar Corp | ||
| Balance Sheet | ||
| as at 30th June | 2014 | 2013 |
| $m | $m | |
| Assets | ||
| Cash | 30 | 29 |
| Accounts receivable | 5 | 7 |
| Pre-paid rent expense | 1 | 0 |
| Inventory | 50 | 46 |
| PPE | 290 | 300 |
| Total assets | 376 | 382 |
| Liabilities | ||
| Trade payables | 20 | 18 |
| Accrued gas expense | 3 | 2 |
| Non-current liabilities | 0 | 0 |
| Contributed equity | 212 | 212 |
| Retained profits | 136 | 150 |
| Asset revaluation reserve | 5 | 0 |
| Total L and OE | 376 | 382 |
Note: all figures are given in millions of dollars ($m).
The firm's free cash flow over the 2014 financial year was:
Question 793 option, hedging, delta hedging, gamma hedging, gamma, Black-Scholes-Merton option pricing
A bank buys 1000 European put options on a $10 non-dividend paying stock at a strike of $12. The bank wishes to hedge this exposure. The bank can trade the underlying stocks and European call options with a strike price of 7 on the same stock with the same maturity. Details of the call and put options are given in the table below. Each call and put option is on a single stock.
| European Options on a Non-dividend Paying Stock | |||
| Description | Symbol | Put Values | Call Values |
| Spot price ($) | ##S_0## | 10 | 10 |
| Strike price ($) | ##K_T## | 12 | 7 |
| Risk free cont. comp. rate (pa) | ##r## | 0.05 | 0.05 |
| Standard deviation of the stock's cont. comp. returns (pa) | ##\sigma## | 0.4 | 0.4 |
| Option maturity (years) | ##T## | 1 | 1 |
| Option price ($) | ##p_0## or ##c_0## | 2.495350486 | 3.601466138 |
| ##N[d_1]## | ##\partial c/\partial S## | 0.888138405 | |
| ##N[d_2]## | ##N[d_2]## | 0.792946442 | |
| ##-N[-d_1]## | ##\partial p/\partial S## | -0.552034778 | |
| ##N[-d_2]## | ##N[-d_2]## | 0.207053558 | |
| Gamma | ##\Gamma = \partial^2 c/\partial S^2## or ##\partial^2 p/\partial S^2## | 0.098885989 | 0.047577422 |
| Theta | ##\Theta = \partial c/\partial T## or ##\partial p/\partial T## | 0.348152078 | 0.672379961 |
Which of the following statements is NOT correct?
The following steps outline the process of ‘negative gearing’ an investment property in Australia. Which of these steps or statements is NOT correct? To successfully achieve negative gearing on an investment property:
Question 926 mean and median returns, return distribution, arithmetic and geometric averages, continuously compounding rate
The arithmetic average continuously compounded or log gross discrete return (AALGDR) on the ASX200 accumulation index over the 24 years from 31 Dec 1992 to 31 Dec 2016 is 9.49% pa.
The arithmetic standard deviation (SDLGDR) is 16.92 percentage points pa.
Assume that the log gross discrete returns are normally distributed and that the above estimates are true population statistics, not sample statistics, so there is no standard error in the sample mean or standard deviation estimates. Also assume that the standardised normal Z-statistic corresponding to a one-tail probability of 2.5% is exactly -1.96.
If you had a $1 million fund that replicated the ASX200 accumulation index, in how many years would the median dollar value of your fund first be expected to lie outside the 95% confidence interval forecast?
Question 948 VaR, expected shortfall
Below is a historical sample of returns on the S&P500 capital index.
| S&P500 Capital Index Daily Returns Ranked from Best to Worst |
||
| 10,000 trading days from 4th August 1977 to 24 March 2017 based on closing prices. |
||
| Rank | Date (DD-MM-YY) |
Continuously compounded daily return (% per day) |
| 1 | 21-10-87 | 9.23 |
| 2 | 08-03-83 | 8.97 |
| 3 | 13-11-08 | 8.3 |
| 4 | 30-09-08 | 8.09 |
| 5 | 28-10-08 | 8.01 |
| 6 | 29-10-87 | 7.28 |
| … | … | … |
| 9980 | 11-12-08 | -5.51 |
| 9981 | 22-10-08 | -5.51 |
| 9982 | 08-08-11 | -5.54 |
| 9983 | 22-09-08 | -5.64 |
| 9984 | 11-09-86 | -5.69 |
| 9985 | 30-11-87 | -5.88 |
| 9986 | 14-04-00 | -5.99 |
| 9987 | 07-10-98 | -6.06 |
| 9988 | 08-01-88 | -6.51 |
| 9989 | 27-10-97 | -6.55 |
| 9990 | 13-10-89 | -6.62 |
| 9991 | 15-10-08 | -6.71 |
| 9992 | 29-09-08 | -6.85 |
| 9993 | 07-10-08 | -6.91 |
| 9994 | 14-11-08 | -7.64 |
| 9995 | 01-12-08 | -7.79 |
| 9996 | 29-10-08 | -8.05 |
| 9997 | 26-10-87 | -8.4 |
| 9998 | 31-08-98 | -8.45 |
| 9999 | 09-10-08 | -12.9 |
| 10000 | 19-10-87 | -23.36 |
| Mean of all 10,000: | 0.0354 | |
| Sample standard deviation of all 10,000: | 1.2062 | |
| Sources: Bloomberg and S&P. | ||
Assume that the one-tail Z-statistic corresponding to a probability of 99.9% is exactly 3.09. Which of the following statements is NOT correct? Based on the historical data, the 99.9% daily:
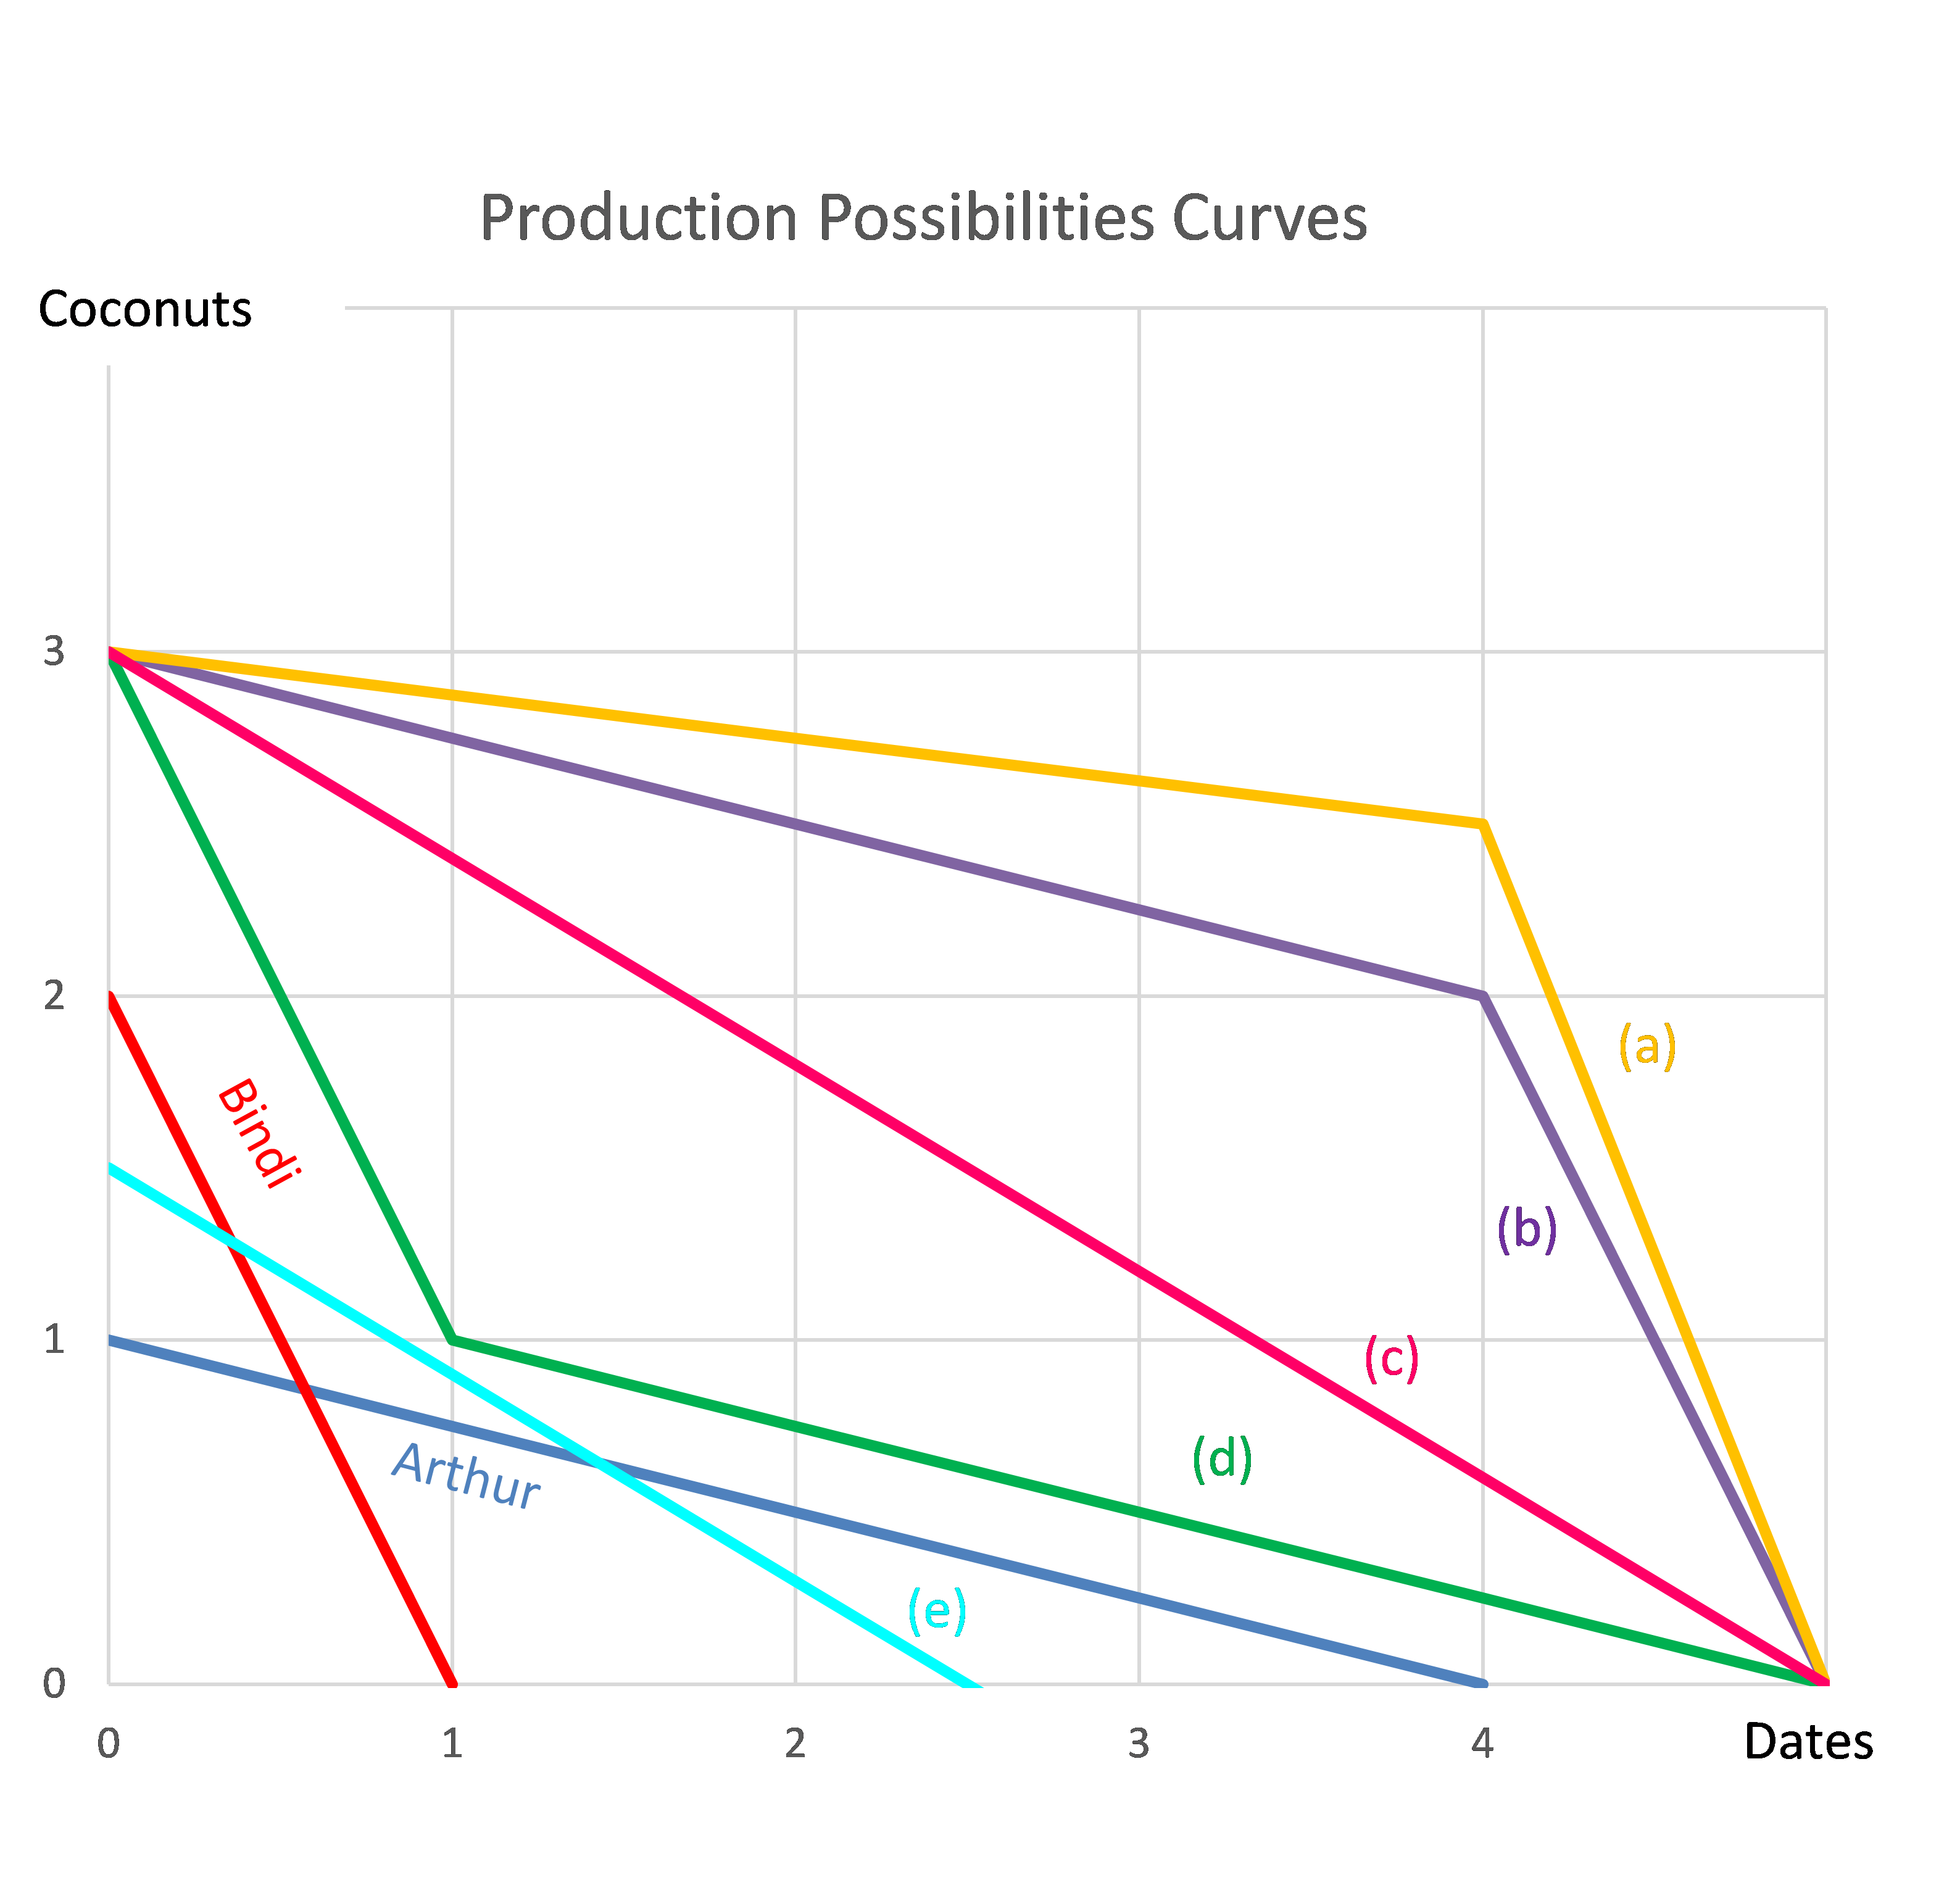
Question 978 comparative advantage in trade, production possibilities curve, no explanation
Arthur and Bindi are the only people on a remote island. Their production possibility curves are shown in the graph.
Assuming that Arthur and Bindi cooperate according to the principles of comparative advantage, what will be their combined production possibilities curve?