A stock is expected to pay the following dividends:
| Cash Flows of a Stock | ||||||
| Time (yrs) | 0 | 1 | 2 | 3 | 4 | ... |
| Dividend ($) | 0 | 6 | 12 | 18 | 20 | ... |
After year 4, the dividend will grow in perpetuity at 5% pa. The required return of the stock is 10% pa. Both the growth rate and required return are given as effective annual rates.
What will be the price of the stock in 7 years (t = 7), just after the dividend at that time has been paid?
Two risky stocks A and B comprise an equal-weighted portfolio. The correlation between the stocks' returns is 70%.
If the variance of stock A's returns increases but the:
- Prices and expected returns of each stock stays the same,
- Variance of stock B's returns stays the same,
- Correlation of returns between the stocks stays the same.
Which of the following statements is NOT correct?
You just bought $100,000 worth of inventory from a wholesale supplier. You are given the option of paying within 5 days and receiving a 2% discount, or paying the full price within 60 days.
You actually don't have the cash to pay within 5 days, but you could borrow it from the bank (as an overdraft) at 10% pa, given as an effective annual rate.
In 60 days you will have enough money to pay the full cost without having to borrow from the bank.
What is the implicit interest rate charged by the wholesale supplier, given as an effective annual rate? Also, should you borrow from the bank in 5 days to pay the supplier and receive the discount? Or just pay the full price on the last possible date?
Assume that there are 365 days per year.
Question 308 risk, standard deviation, variance, no explanation
A stock's standard deviation of returns is expected to be:
- 0.09 per month for the first 5 months;
- 0.14 per month for the next 7 months.
What is the expected standard deviation of the stock per year ##(\sigma_\text{annual})##?
Assume that returns are independently and identically distributed (iid) and therefore have zero auto-correlation.
One year ago you bought $100,000 of shares partly funded using a margin loan. The margin loan size was $70,000 and the other $30,000 was your own wealth or 'equity' in the share assets.
The interest rate on the margin loan was 7.84% pa.
Over the year, the shares produced a dividend yield of 4% pa and a capital gain of 5% pa.
What was the total return on your wealth? Ignore taxes, assume that all cash flows (interest payments and dividends) were paid and received at the end of the year, and all rates above are effective annual rates.
Hint: Remember that wealth in this context is your equity (E) in the house asset (V = D+E) which is funded by the loan (D) and your deposit or equity (E).
Read the following financial statements and calculate the firm's free cash flow over the 2014 financial year.
| UBar Corp | ||
| Income Statement for | ||
| year ending 30th June 2014 | ||
| $m | ||
| Sales | 293 | |
| COGS | 200 | |
| Rent expense | 15 | |
| Gas expense | 8 | |
| Depreciation | 10 | |
| EBIT | 60 | |
| Interest expense | 0 | |
| Taxable income | 60 | |
| Taxes | 18 | |
| Net income | 42 | |
| UBar Corp | ||
| Balance Sheet | ||
| as at 30th June | 2014 | 2013 |
| $m | $m | |
| Assets | ||
| Cash | 30 | 29 |
| Accounts receivable | 5 | 7 |
| Pre-paid rent expense | 1 | 0 |
| Inventory | 50 | 46 |
| PPE | 290 | 300 |
| Total assets | 376 | 382 |
| Liabilities | ||
| Trade payables | 20 | 18 |
| Accrued gas expense | 3 | 2 |
| Non-current liabilities | 0 | 0 |
| Contributed equity | 212 | 212 |
| Retained profits | 136 | 150 |
| Asset revaluation reserve | 5 | 0 |
| Total L and OE | 376 | 382 |
Note: all figures are given in millions of dollars ($m).
The firm's free cash flow over the 2014 financial year was:
A stock has a beta of 1.5. The market's expected total return is 10% pa and the risk free rate is 5% pa, both given as effective annual rates.
Over the last year, bad economic news was released showing a higher chance of recession. Over this time the share market fell by 1%. So ##r_{m} = (P_{0} - P_{-1})/P_{-1} = -0.01##, where the current time is zero and one year ago is time -1. The risk free rate was unchanged.
What do you think was the stock's historical return over the last year, given as an effective annual rate?
The below diagram shows a firm’s cash cycle.
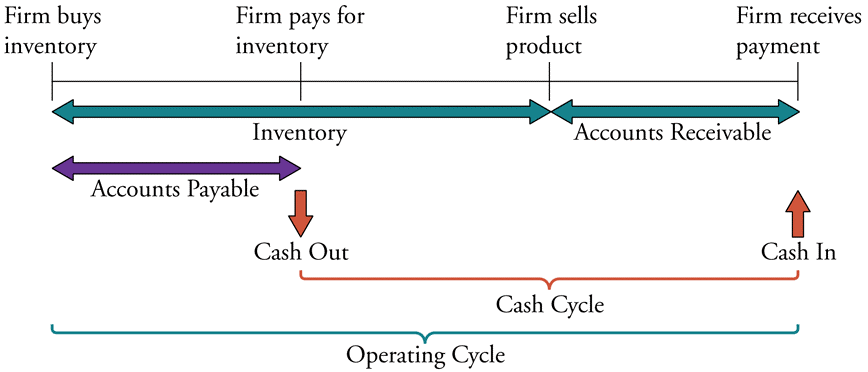
Which of the following statements about companies’ cash cycle is NOT correct?
Question 889 cross currency interest rate parity, no explanation
Judging by the graph, in 2018 the USD short term interest rate set by the US Federal Reserve is higher than the JPY short term interest rate set by the Bank of Japan, which is higher than the EUR short term interest rate set by the European central bank.
At the latest date shown in 2018: ##r_{USD}>r_{JPY}>r_{EUR}##
Assume that each currency’s yield curve is flat at the latest date shown in 2018, so interest rates are expected to remain at their current level into the future.
Which of the following statements is NOT correct?
Over time you would expect the: