Katya offers to pay you $10 at the end of every year for the next 5 years (t=1,2,3,4,5) if you pay her $50 now (t=0). You can borrow and lend from the bank at an interest rate of 10% pa, given as an effective annual rate. Ignore credit risk.
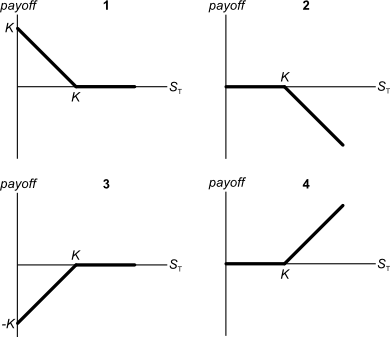
Below are 4 option graphs. Note that the y-axis is payoff at maturity (T). What options do they depict? List them in the order that they are numbered.
A firm can issue 5 year annual coupon bonds at a yield of 8% pa and a coupon rate of 12% pa.
The beta of its levered equity is 1. Five year government bonds yield 5% pa with a coupon rate of 6% pa. The market's expected dividend return is 4% pa and its expected capital return is 6% pa.
The firm's debt-to-equity ratio is 2:1. The corporate tax rate is 30%.
What is the firm's after-tax WACC? Assume a classical tax system.
Calculate the effective annual rates of the following three APR's:
- A credit card offering an interest rate of 18% pa, compounding monthly.
- A bond offering a yield of 6% pa, compounding semi-annually.
- An annual dividend-paying stock offering a return of 10% pa compounding annually.
All answers are given in the same order:
##r_\text{credit card, eff yrly}##, ##r_\text{bond, eff yrly}##, ##r_\text{stock, eff yrly}##
Find Trademark Corporation's Cash Flow From Assets (CFFA), also known as Free Cash Flow to the Firm (FCFF), over the year ending 30th June 2013.
| Trademark Corp | ||
| Income Statement for | ||
| year ending 30th June 2013 | ||
| $m | ||
| Sales | 100 | |
| COGS | 25 | |
| Operating expense | 5 | |
| Depreciation | 20 | |
| Interest expense | 20 | |
| Income before tax | 30 | |
| Tax at 30% | 9 | |
| Net income | 21 | |
| Trademark Corp | ||
| Balance Sheet | ||
| as at 30th June | 2013 | 2012 |
| $m | $m | |
| Assets | ||
| Current assets | 120 | 80 |
| PPE | ||
| Cost | 150 | 140 |
| Accumul. depr. | 60 | 40 |
| Carrying amount | 90 | 100 |
| Total assets | 210 | 180 |
| Liabilities | ||
| Current liabilities | 75 | 65 |
| Non-current liabilities | 75 | 55 |
| Owners' equity | ||
| Retained earnings | 10 | 10 |
| Contributed equity | 50 | 50 |
| Total L and OE | 210 | 180 |
Note: all figures are given in millions of dollars ($m).
The following table shows a sample of historical total returns of shares in two different companies A and B.
| Stock Returns | ||
| Total effective annual returns | ||
| Year | ##r_A## | ##r_B## |
| 2007 | 0.2 | 0.4 |
| 2008 | 0.04 | -0.2 |
| 2009 | -0.1 | -0.3 |
| 2010 | 0.18 | 0.5 |
What is the historical sample covariance (##\hat{\sigma}_{A,B}##) and correlation (##\rho_{A,B}##) of stock A and B's total effective annual returns?
Let the variance of returns for a share per month be ##\sigma_\text{monthly}^2##.
What is the formula for the variance of the share's returns per year ##(\sigma_\text{yearly}^2)##?
Assume that returns are independently and identically distributed (iid) so they have zero auto correlation, meaning that if the return was higher than average today, it does not indicate that the return tomorrow will be higher or lower than average.
Acquirer firm plans to launch a takeover of Target firm. The deal is expected to create a present value of synergies totaling $105 million. A scrip offer will be made that pays the fair price for the target's shares plus 75% of the total synergy value.
| Firms Involved in the Takeover | ||
| Acquirer | Target | |
| Assets ($m) | 6,000 | 700 |
| Debt ($m) | 4,800 | 400 |
| Share price ($) | 40 | 20 |
| Number of shares (m) | 30 | 15 |
Ignore transaction costs and fees. Assume that the firms' debt and equity are fairly priced, and that each firms' debts' risk, yield and values remain constant. The acquisition is planned to occur immediately, so ignore the time value of money.
Calculate the merged firm's share price and total number of shares after the takeover has been completed.
An investor bought a 5 year government bond with a 2% pa coupon rate at par. Coupons are paid semi-annually. The face value is $100.
Calculate the bond's new price 8 months later after yields have increased to 3% pa. Note that both yields are given as APR's compounding semi-annually. Assume that the yield curve was flat before the change in yields, and remained flat afterwards as well.
Question 881 Nixon Shock, Bretton Woods, foreign exchange rate, foreign exchange system history, no explanation
In the ‘Nixon Shock’ on August 15, 1971, the United States government: