A stock is expected to pay the following dividends:
| Cash Flows of a Stock | ||||||
| Time (yrs) | 0 | 1 | 2 | 3 | 4 | ... |
| Dividend ($) | 0.00 | 1.15 | 1.10 | 1.05 | 1.00 | ... |
After year 4, the annual dividend will grow in perpetuity at -5% pa. Note that this is a negative growth rate, so the dividend will actually shrink. So,
- the dividend at t=5 will be ##$1(1-0.05) = $0.95##,
- the dividend at t=6 will be ##$1(1-0.05)^2 = $0.9025##, and so on.
The required return on the stock is 10% pa. Both the growth rate and required return are given as effective annual rates.
What is the current price of the stock?
Estimate the Chinese bank ICBC's share price using a backward-looking price earnings (PE) multiples approach with the following assumptions and figures only. Note that the renminbi (RMB) is the Chinese currency, also known as the yuan (CNY).
- The 4 major Chinese banks ICBC, China Construction Bank (CCB), Bank of China (BOC) and Agricultural Bank of China (ABC) are comparable companies;
- ICBC 's historical earnings per share (EPS) is RMB 0.74;
- CCB's backward-looking PE ratio is 4.59;
- BOC 's backward-looking PE ratio is 4.78;
- ABC's backward-looking PE ratio is also 4.78;
Note: Figures sourced from Google Finance on 25 March 2014. Share prices are from the Shanghai stock exchange.
Many Australian home loans that are interest-only actually require payments to be made on a fully amortising basis after a number of years.
You decide to borrow $600,000 from the bank at an interest rate of 4.25% pa for 25 years. The payments will be interest-only for the first 10 years (t=0 to 10 years), then they will have to be paid on a fully amortising basis for the last 15 years (t=10 to 25 years).
Assuming that interest rates will remain constant, what will be your monthly payments over the first 10 years from now, and then the next 15 years after that? The answer options are given in the same order.
What is the correlation of a variable X with itself?
The corr(X, X) or ##\rho_{X,X}## equals:
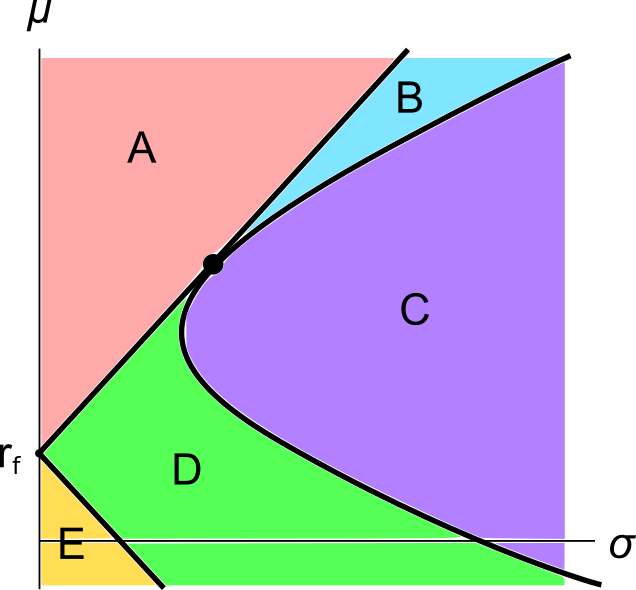
A graph of assets’ expected returns ##(\mu)## versus standard deviations ##(\sigma)## is given in the below diagram.
Each letter corresponds to a separate coloured area. The portfolios at the boundary of the areas, on the black lines, are excluded from each area. Assume that all assets represented in this graph are fairly priced, and that all risky assets can be short-sold.
Which of the following statements about this graph and Markowitz portfolio theory is NOT correct?
When does a European option's last-traded market price become a sunk cost?
Question 899 comparative advantage in trade, production possibilities curve, no explanation
Adam and Bella are the only people on a remote island. Their production possibility curves are shown in the graph.
Assume that Adam and Bella cooperate according to the principle of comparative advantage.
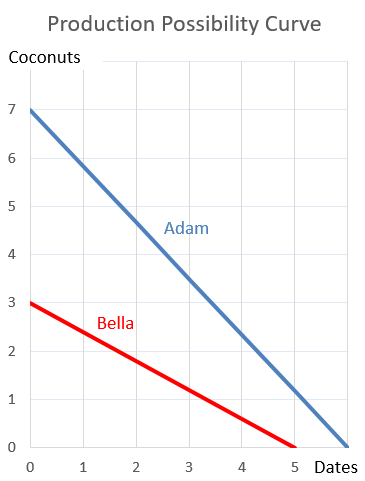
Which of the following statements is NOT correct?
The market's expected total return is 10% pa and the risk free rate is 5% pa, both given as effective annual rates.
A stock has a beta of 0.7.
In the last 5 minutes, bad economic news was released showing a higher chance of recession. Over this time the share market fell by 2%. The risk free rate was unchanged. What do you think was the stock's historical return over the last 5 minutes, given as an effective 5 minute rate?