Katya offers to pay you $10 at the end of every year for the next 5 years (t=1,2,3,4,5) if you pay her $50 now (t=0). You can borrow and lend from the bank at an interest rate of 10% pa, given as an effective annual rate. Ignore credit risk.
Paying $50 to Katya now in exchange for receiving $10 at the end of each year for 5 years might seem like a fair deal since ##5 \times 10 = 50##, but it's not. Katya is proposing an unfair deal that benefits her at your expense.
An amount of $50 now is worth more than 5 payments of $10 over 5 years since Katya can put your $50 payment in the bank, pay you $10 at the end of the first year, and keep the $5 ##(=0.1\times 50)## interest earned on the $50 for herself. In the second year, she starts with $45 ##(=50+5-10)## in the bank, and she receives 4.5 ##(=0.1\times 45)## interest that she can keep for herself, and so on.
To find the value of the deal to you right now, we find the present value using the annuity equation. The cash flows received are positive and the cash flows paid are negative.
###\begin{aligned} V_0 &= C_0 + \frac{C_{1,2...T}}{r} \left( 1-\frac{1}{(1+r)^T} \right) \\ &= -50 + \frac{10}{0.1} \left( 1-\frac{1}{(1+0.1)^5} \right) \\ &= -50 + 37.90786769 \\ &= -12.092132306 \\ \end{aligned}###
Therefore, accepting the deal would reduce your current wealth by $12.09, and increase Katya's current wealth by $12.09.
This annuity formula ##\dfrac{C_1}{r}\left(1-\dfrac{1}{(1+r)^3} \right)## is equivalent to which of the following formulas? Note the 3.
In the below formulas, ##C_t## is a cash flow at time t. All of the cash flows are equal, but paid at different times.
The annuity formula with T cash flows sums the present value of each, where the first is at time 1 and the last at time T:
###\dfrac{C}{r}\left(1-\dfrac{1}{(1+r)^T} \right) = \dfrac{C_1}{(1+r)^1} +\dfrac{C_2}{(1+r)^2} + ... + \dfrac{C_T}{(1+r)^T} ###The annuity formula with 3 cash flows sums the present value of each, where the first is at time 1 and the last at time 3:
###\dfrac{C}{r}\left(1-\dfrac{1}{(1+r)^3} \right) = \dfrac{C_1}{(1+r)^1} +\dfrac{C_2}{(1+r)^2} + \dfrac{C_3}{(1+r)^3} ###Your friend overheard that you need some cash and asks if you would like to borrow some money. She can lend you $5,000 now (t=0), and in return she wants you to pay her back $1,000 in two years (t=2) and every year after that for the next 5 years, so there will be 6 payments of $1,000 from t=2 to t=7 inclusive.
What is the net present value (NPV) of borrowing from your friend?
Assume that banks loan funds at interest rates of 10% pa, given as an effective annual rate.
The annuity formula can be applied to find the present value of the 6 equal payments from t=2 to 7. But care must be taken since the present value of an annuity is one period before the first cash flow (at t=2), so the whole annuity value will be at t=1 so it needs to be discounted back one extra period to get a present value.
###\begin{aligned} V_0 &= C_0 - \dfrac{ C_2.\dfrac{1}{r}\left( 1-\dfrac{1}{(1+r)^6} \right) }{(1+r)^1} \\ &= 5,000 - \dfrac{ 1,000 \times \dfrac{1}{0.1}\left( 1-\dfrac{1}{(1+0.1)^6} \right) }{(1+0.1)^1} \\ &= 5,000 - 3,959.3279 \\ &= 1,040.6721 \\ \end{aligned}###Some countries' interest rates are so low that they're zero.
If interest rates are 0% pa and are expected to stay at that level for the foreseeable future, what is the most that you would be prepared to pay a bank now if it offered to pay you $10 at the end of every year for the next 5 years?
In other words, what is the present value of five $10 payments at time 1, 2, 3, 4 and 5 if interest rates are 0% pa?
When the yield is zero, there is no time value of money. Therefore we can just sum cash flows like an accountant.
###\begin{aligned} V_0 &= T \times C \\ &= 5 \times 10 = 50 \\ \end{aligned}###
Interestingly, the normal way to value an annuity with the annuity equation will not work since there will be a divide by zero problem which is mathematically impossible:
###\begin{aligned} V_0 &= C_\text{1} \times \frac{1}{r_\text{eff yrly}} \left( 1 - \frac{1}{(1+r_\text{eff yrly})^{T}} \right) \\ &= 1 \times \color{red}{\frac{1}{0}} \left( 1 - \frac{1}{(1+0)^{5}} \right) \\ \end{aligned}###
Since 1/0 is mathematically undefined, that is a dead-end.
But present-valuing the individual payments separately will still work.
###\begin{aligned} P_0 &= \frac{C_\text{1 yr}}{(1+r_\text{eff yrly})^1} + \frac{C_\text{2 yr}}{(1+r_\text{eff yrly})^2} + \frac{C_\text{3 yr}}{(1+r_\text{eff yrly})^3} + \frac{C_\text{4 yr}}{(1+r_\text{eff yrly})^4} +\frac{C_\text{5 yr}}{(1+r_\text{eff yrly})^5} \\ &= \frac{10}{(1+0)^1} + \frac{10}{(1+0)^2} + \frac{10}{(1+0)^3} + \frac{10}{(1+0)^4} +\frac{10}{(1+0)^5} \\ &= 10+10+10+10+10 \\ &= 5 \times 10 \\ &= 50 \\ \end{aligned}###
Discounted cash flow (DCF) valuation prices assets by finding the present value of the asset's future cash flows. The single cash flow, annuity, and perpetuity equations are very useful for this.
Which of the following equations is the 'perpetuity with growth' equation?
The perpetuity with growth equation is:
###V_0=\dfrac{C_1}{r-g} = \sum\limits_{t=1}^\infty \left( \dfrac{C_t.(1+g)^t}{(1+r)^t} \right) ###See the dividend discount model Wikipedia page for a derivation of how the infinite sum has a closed-form solution.
A stock is expected to pay its next dividend of $1 in one year. Future annual dividends are expected to grow by 2% pa. So the first dividend of $1 will be in one year, the year after that $1.02 (=1*(1+0.02)^1), and a year later $1.0404 (=1*(1+0.02)^2) and so on forever.
Its required total return is 10% pa. The total required return and growth rate of dividends are given as effective annual rates.
Calculate the current stock price.
Use the perpetuity with growth formula to price the annual dividend paying stock.
###\begin{aligned} p_0 &= \dfrac{c_1}{r - g} \\ &= \dfrac{1}{0.1 - 0.02} \\ &= 12.50 \\ \end{aligned}###A stock just paid a dividend of $1. Future annual dividends are expected to grow by 2% pa. The next dividend of $1.02 (=1*(1+0.02)^1) will be in one year, and the year after that the dividend will be $1.0404 (=1*(1+0.02)^2), and so on forever.
Its required total return is 10% pa. The total required return and growth rate of dividends are given as effective annual rates.
Calculate the current stock price.
Use the perpetuity with growth formula to price the annual dividend paying stock. But remember that the dividend at time zero was already paid, so if you purchase the share now you will not receive the dividend and therefore it is not included in the stock price, so we ignore it. Focus on the future dividends which we will receive, and the next is in one year (t=1) and will be $1.02.
###\begin{aligned} p_0 &= \dfrac{c_1}{r - g} \\ &= \dfrac{c_0(1+g)^1}{r - g} \\ &= \dfrac{1(1+0.02)^1}{0.1 - 0.02} \\ &= \dfrac{1.02}{0.08} \\ &= 12.75 \\ \end{aligned}###A stock is just about to pay a dividend of $1 tonight. Future annual dividends are expected to grow by 2% pa. The next dividend of $1 will be paid tonight, and the year after that the dividend will be $1.02 (=1*(1+0.02)^1), and a year later 1.0404 (=1*(1+0.04)^2) and so on forever.
Its required total return is 10% pa. The total required return and growth rate of dividends are given as effective annual rates.
Calculate the current stock price.
Use the perpetuity with growth formula to price the annual dividend paying stock. But remember that the dividend at time zero is just about to be paid, so if you purchase the share now you will receive the dividend and therefore it is included in the stock price.
This immediate $1 dividend can be added separately to the perpetuity. It's a value at time zero so there's no need to discount it.
###\begin{aligned} p_0 &= c_0 + \dfrac{c_1}{r - g} \\ &= c_0 + \dfrac{c_0 (1+g)^1}{r - g} \\ &= 1+ \dfrac{1 (1+0.02)^1}{0.1 - 0.02} \\ &= 1+ 12.75 \\ &= 13.75 \\ \end{aligned}###Or, this immediate $1 dividend can be included in the perpetuity formula, but that means that the first cash flow will be at time zero and therefore the perpetuity will be at time negative one, so it needs growing forward one period to time zero.
###\begin{aligned} p_0 &= \dfrac{c_0}{r - g} \times (1+ r)^1 \\ &= \dfrac{1}{0.1 - 0.02} \times (1+0.1)^1 \\ &= 12.50 \times (1+0.1)^1 \\ &= 13.75 \\ \end{aligned}###For a price of $13, Carla will sell you a share paying a dividend of $1 in one year and every year after that forever. The required return of the stock is 10% pa.
For a price of $1040, Camille will sell you a share which just paid a dividend of $100, and is expected to pay dividends every year forever, growing at a rate of 5% pa.
So the next dividend will be ##100(1+0.05)^1=$105.00##, and the year after it will be ##100(1+0.05)^2=110.25## and so on.
The required return of the stock is 15% pa.
The perpetuity with growth formula, also known as the dividend discount model (DDM) or Gordon growth model, is appropriate for valuing a company's shares. ##P_0## is the current share price, ##C_1## is next year's expected dividend, ##r## is the total required return and ##g## is the expected growth rate of the dividend.
###P_0=\dfrac{C_1}{r-g}###
The below graph shows the expected future price path of the company's shares. Which of the following statements about the graph is NOT correct?
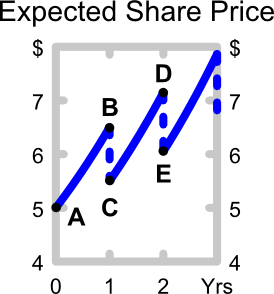
Between points D and E, the share price is expected to instantaneously fall by:
###C_2 = C_1.(1+\mathbf{g})^1###This is because the second dividend ##C_2## is expected to be equal to the first dividend ##C_1## grown by the dividend growth rate ##g##, not the total return ##r##.
The following equation is the Dividend Discount Model, also known as the 'Gordon Growth Model' or the 'Perpetuity with growth' equation.
###P_0=\frac{d_1}{r-g}###
A stock pays dividends annually. It just paid a dividend, but the next dividend (##d_1##) will be paid in one year.
According to the DDM, what is the correct formula for the expected price of the stock in 2.5 years?
The growth rate in the dividend (##g##) must equal the growth rate in the stock price measured between a whole number of dividend periods. But the growth rate in stock price, also known as the capital return, is actually equal to the total return ##r## in between dividend payments. This is best seen in a saw-tooth graph, where the 'dividend drop-off' price fall can be seen every time a stock pays a dividend. But here it's explained in words:
- The expected capital return measured just after a dividend is paid to just after the next dividend is paid is ##g##.
- The expected capital return measured just before a dividend is paid to just before the next dividend is paid is also ##g##.
- But, the expected capital return measured just after a dividend is paid to just before the next dividend is paid is actually ##r##. The price growth must be higher than ##g## since the stock price must accumulate the next dividend payment as well as the usual price gain over a whole dividend period. Thus the price growth between dividend payments must be ##r = d_1/P_0 + g##.
Using this logic, the growth rate in the share price from just after the current (t=0) dividend was paid to just after the next dividend is paid in one year will be ##g##.
###P_\text{1, just after div} = P_\text{0, just after div}(1+g)^1### Similarly for the next year, just after that dividend is paid (at t=2).###\begin{aligned} P_\text{2, just after div} &= P_\text{1, just after div}(1+g)^1 \\ &= P_\text{0, just after div}(1+g)^2 \\ \end{aligned}###
But from just after the second dividend is paid at t=2 to t=2.5, that period is in between dividend payments, so the share price growth will be the total return ##r##.
###\begin{aligned} P_\text{2.5} &= P_\text{2, just after div}(1+r)^{0.5} \\ &= P_\text{0, just after div}(1+g)^2(1+r)^{0.5} \\ \end{aligned}###
The following equation is the Dividend Discount Model, also known as the 'Gordon Growth Model' or the 'Perpetuity with growth' equation.
### P_{0} = \frac{C_1}{r_{\text{eff}} - g_{\text{eff}}} ###
What would you call the expression ## C_1/P_0 ##?
For a stock, the expected income return is the ratio of the dividend expected to be paid in one year to the stock price now. Another name for it is the expected dividend yield.
Rearranging this equation:
###P_{0} = \frac{C_1}{r_{\text{eff}} - g_{\text{eff}}} ### ###r_{\text{eff}} - g_{\text{eff}} = \frac{C_1}{P_{0}} ### ###r_{\text{eff}} = g_{\text{eff}} + \frac{C_1}{P_{0}} ###This is equivalent to:
###\begin{aligned} r_{\text{eff, total}} =& r_{\text{eff, capital}} + r_{\text{eff, income}} \\ \end{aligned} ###
Where ##r_{\text{eff, capital}} = g## and ##r_{\text{eff, income}} = d_1/p_0##.
The following is the Dividend Discount Model (DDM) used to price stocks:
###P_0=\dfrac{C_1}{r-g}###
If the assumptions of the DDM hold and the stock is fairly priced, which one of the following statements is NOT correct? The long term expected:
All statements are true except for answer c. The expected dividend yield is defined as ##c_1/p_0## whereas the expected growth rate in the dividend is ##g##.
Rearranging this equation:
###P_{0} = \dfrac{C_1}{r - g} ### ###r - g = \dfrac{C_1}{P_{0}} ### ###r = g + \dfrac{C_1}{P_{0}} ###This is equivalent to:
###\begin{aligned} r_{\text{total}} =& r_{\text{capital}} + r_{\text{income}} \\ \end{aligned} ###
Where ##r_{\text{capital}} = g## and ##r_{\text{income}} = C_1/P_0##. Note that the expected dividend yield can also be called the share's expected income return ##r_{\text{income}}##.
Question 497 income and capital returns, DDM, ex dividend date
A stock will pay you a dividend of $10 tonight if you buy it today. Thereafter the annual dividend is expected to grow by 5% pa, so the next dividend after the $10 one tonight will be $10.50 in one year, then in two years it will be $11.025 and so on. The stock's required return is 10% pa.
What is the stock price today and what do you expect the stock price to be tomorrow, approximately?
This question is interesting because it shows how the share price falls after the rights to the dividend detach from the share. Another way of looking at it is that higher dividends lead to lower share prices, all things remaining equal. At first glance it's a surprise that share prices fall due to dividends, but it makes sense because the money that the company had in its bank account is then paid to shareholders' bank accounts, so of course the company and its shares are worth less. Shareholders are not upset about this because they receive the money in their personal bank account.
If you buy the share today you will receive the dividend tonight, so the share price today will include the value of this dividend. There are two methods to calculate its price today:
Today's price method 1
Simply add the dividend tonight together with the perpetuity of payments which includes the dividend in one year, two years and so on forever.
###\begin{aligned} P_\text{0, today} &= C_0 + \dfrac{C_1}{r-g} \\ &= 10+ \dfrac{10 \times (1+0.05)^1}{0.1 - 0.05} \\ &= 10+ \dfrac{10.50}{0.05} \\ &= 10+ 210 \\ &= 220 \\ \end{aligned}###Today's price method 2
An alternative method which gives the same answer is to include the very first $10 received at time zero in the perpetuity, which will give a total value at time minus one, one period before the first cash flow at time zero. Then grow the value forward by one period using the total return: ###P_{-1} = \dfrac{C_0}{r-g} ### ###\begin{aligned} P_\text{0, today} &= P_{-1}.(1+r)^1 \\ &= \dfrac{C_0}{r-g}.(1+r)^1 \\ &= \dfrac{10}{0.1 - 0.05} \times (1+0.1)^1 \\ &= 200 \times 1.1 \\ &= 220 \\ \end{aligned}###
Tomorrow's approximate price
To find the price tomorrow, just after the $10 dividend tonight is paid, subtract the dividend received overnight from the price yesterday ##220 - 10 = 210##, or just calculate a perpetuity of payments starting in one year:
###\begin{aligned} P_\text{0, tomorrow} &= \dfrac{C_1}{r-g} \\ &= \dfrac{10 \times (1+0.05)^1}{0.1 - 0.05} \\ &= \dfrac{10.50}{0.05} \\ &= 210 \\ \end{aligned}###Tomorrow's exact price
While the answer to the question only asked for an 'approximate' price, we can calculate the exact expected price tomorrow. The stock price is expected to appreciate slightly overnight because the stock price increases by the total return between dividend payments. Examine the familiar saw-tooth diagram to see this. Assuming that there are 365 days in the year, then the price in one day, which is 1/365th or 0.002739726 of a year, should be:
###\begin{aligned} P_\text{1/365, tomorrow} &= \dfrac{C_1}{r-g}.(1+r)^{1/365} \\ P_\text{0.002739726, tomorrow} &= \dfrac{C_1}{r-g}.(1+r)^{0.002739726} \\ &= \dfrac{10 \times (1+0.05)^1}{0.1 - 0.05} \times (1+0.1)^{1/365} \\ &= 210.0548432 \end{aligned}###In the dividend discount model:
###P_0 = \dfrac{C_1}{r-g}###
The return ##r## is supposed to be the:
Future cash flows and returns are important.
Owners of assets such as shares are entitled to the future cash flows only, not the past cash flows which have already been paid. This is why asset prices are the present value of future cash flows.
To calculate the present value of future dividends, the dividend discount model must use the future expected return ##r## and growth rate ##g## of the market price of equity.
Of course the future is impossible to predict. Often the best guide to the future is the past, so in practice the actual historical return and growth rate are used as a proxy for what's expected in the future.
Market prices are important.
In finance, current market prices are always more important and relevant than old historical cost book prices. The market price of a share is the price that it trades for every day on the stock exchange. It's the price that a buyer will actually pay to buy the share.
When the share was first bought, the market price and book price were the same. But after that, the book price never changes while the market price goes up and down every day. Therefore the book price is old and out of date. Generally it is not the same as the current market price, unless by coincidence.
Owners equity recorded by an accountant in the firm's balance sheet is the sum of the shareholders' equity (also called contributed equity), retained profits and reserves such as asset revaluation reserve. This is often very different to the market price of equity. If the firm has been successful in the past, usually the market price of equity will be much higher than the book price.
Equity returns calculated from book prices are also therefore not very useful to determine value. They reflect the past, not the future. Therefore accounting ratios such as ROE (Net Income/Owners Equity) and ROA (Net Income/Total Assets) are not very useful for pricing stocks. But they are a reasonable guide to past performance.
A stock pays annual dividends which are expected to continue forever. It just paid a dividend of $10. The growth rate in the dividend is 2% pa. You estimate that the stock's required return is 10% pa. Both the discount rate and growth rate are given as effective annual rates. Using the dividend discount model, what will be the share price?
The $10 dividend that was just paid (at t=0, a moment ago) in the past will not be paid to whoever buys the stock now, therefore it should be left out of the valuation. Every investment is priced based on its future cash flows, not past cash flows. Therefore, we're more interested in the next annual dividend ##C_1##, which will equal the old one ##C_0## grown by the growth rate: ##C_1 = C_0 (1+g)^1 = 10 \times (1+0.02)^1 = 10.2##
###\begin{aligned} P_{0} &= \frac{C_1}{r - g} \\ &= \frac{C_0(1+g)^1}{r - g} \\ &= \frac{10(1+0.02)^1}{0.1 - 0.02} = \frac{10.20}{0.08} = 127.5 \\ \end{aligned} ###
A stock is expected to pay the following dividends:
| Cash Flows of a Stock | ||||||
| Time (yrs) | 0 | 1 | 2 | 3 | 4 | ... |
| Dividend ($) | 0.00 | 1.00 | 1.05 | 1.10 | 1.15 | ... |
After year 4, the annual dividend will grow in perpetuity at 5% pa, so;
- the dividend at t=5 will be $1.15(1+0.05),
- the dividend at t=6 will be $1.15(1+0.05)^2, and so on.
The required return on the stock is 10% pa. Both the growth rate and required return are given as effective annual rates.
What will be the price of the stock in three and a half years (t = 3.5)?
###\begin{aligned} P_{3.5} =& \frac{C_4}{r-g} \times (1+r)^{0.5} \\ =& \frac{1.15}{0.1- 0.05} \times (1+0.1)^{0.5} \\ =& 23 \times (1+0.1)^{0.5} \\ =& 24.12260351 \\ \end{aligned} ###
Note that ## \frac{C_4}{r-g} ## is ## P_3 ##, and this amount is grown forward half a period by the total return (r), not the capital return (g). This may seem counter-intuitive since you would normally grow the dividend or the price forward by g. But in this case the stock price needs to be grown by the total return (r) because we are growing the price in between dividend payments. The stock price needs to grow by the higher total return so it is big enough to pay the dividend and fall in price, but still have realised a capital return (g).
Another way of thinking about it is that the growth rate in the stock price between t=3 and 3.5 needs to include not just the capital growth (g), but also the accrued dividend which will be paid at t=4 and which is part of the stock price until it is paid.
This concept is best illustrated by the 'saw-tooth' graph of expected share price vs time.
The following equation is the Dividend Discount Model, also known as the 'Gordon Growth Model' or the 'Perpetuity with growth' equation.
### p_0 = \frac{d_1}{r - g} ###
Which expression is NOT equal to the expected dividend yield?
Answer (e) is incorrect because it grows the stock price by the total return (r) instead of the capital return (g). While it is true that in between dividend payments the stock price grows by the total return (r), the dividend payments reduce the stock price. This means that the stock price grows by the total return (r) less the dividend yield (##d_{t+1}/p_t##) which equals the capital return (g) over a whole period.
This concept is best illustrated in a 'saw-tooth' graph of expected share price versus time.
A fairly valued share's current price is $4 and it has a total required return of 30%. Dividends are paid annually and next year's dividend is expected to be $1. After that, dividends are expected to grow by 5% pa in perpetuity. All rates are effective annual returns.
What is the expected dividend income paid at the end of the second year (t=2) and what is the expected capital gain from just after the first dividend (t=1) to just after the second dividend (t=2)? The answers are given in the same order, the dividend and then the capital gain.
Since dividends are expected to grow in perpetuity and the share is fairly priced, the dividend discount model (DDM) applies. The dividends and share price will grow at the same rate of 5% pa. For an explanation of why see question 3.
Let the dividend cash flow be ##c##, the price be ##p##, the capital return be ##r_\text{capital}## and the total return be ##r_\text{capital}##.
###\begin{aligned} c_2 &= c_1(1+r_\text{capital})^1 \\ &= 1(1+0.05)^1 \\ &= 1.05 \\ \end{aligned}###To find the capital gain from just after the first dividend (t=1) to just after the second dividend (t=2), find the price increase between time 1 and 2.
###\begin{aligned} p_1 &= p_0(1+r_\text{capital})^1 \\ &= 4(1+0.05)^1 \\ &= 4.2 \\ \end{aligned}### ###\begin{aligned} p_2 &= p_0(1+r_\text{capital})^2 \\ &= 4(1+0.05)^2 \\ &= 4.41 \\ \end{aligned}###The capital gain is the price increase which is the difference between ##p_2## and ##p_1##. ###\begin{aligned} \text{Capital gain over second year} &= p_2 - p_1 \\ &= 4.41 - 4.2 \\ &= 0.21 \\ \end{aligned}###
Another method which gives the same expected share prices is to grow by the total return and subtract the dividends at the appropriate time.
###\begin{aligned} p_1 &= p_0(1+r_\text{total})^1 - c_1 \\ &= 4(1+0.3)^1 - 1 \\ &= 5.2 - 1 \\ &= 4.2 \\ \end{aligned}### ###\begin{aligned} p_2 &= \left( p_1 - c_1 \right)(1+r_\text{total})^1 - c_2 \\ &= \left( p_0(1+r_\text{total})^1 - c_1 \right)(1+r_\text{total})^1 - c_1(1+r_\text{capital})^1 \\ &= \left( 4(1+0.3)^1 - 1 \right)(1+0.3)^1 - 1(1+0.05)^1 \\ &= (5.2 - 1) \times 1.30 - 1.05 \\ &= 4.41 \\ \end{aligned}###Question 50 DDM, stock pricing, inflation, real and nominal returns and cash flows
Most listed Australian companies pay dividends twice per year, the 'interim' and 'final' dividends, which are roughly 6 months apart.
You are an equities analyst trying to value the company BHP. You decide to use the Dividend Discount Model (DDM) as a starting point, so you study BHP's dividend history and you find that BHP tends to pay the same interim and final dividend each year, and that both grow by the same rate.
You expect BHP will pay a $0.55 interim dividend in six months and a $0.55 final dividend in one year. You expect each to grow by 4% next year and forever, so the interim and final dividends next year will be $0.572 each, and so on in perpetuity.
Assume BHP's cost of equity is 8% pa. All rates are quoted as nominal effective rates. The dividends are nominal cash flows and the inflation rate is 2.5% pa.
What is the current price of a BHP share?
Method 1: Make two perpetuities.
Find the present value of the annual interim dividends and the annual final dividends as two separate perpetuities and add them together to get the share price.
###\begin{aligned} P_0 &= V_\text{0, perp of interim dividends} + V_\text{0, perp of final dividends} \\ &= \frac{C_\text{0.5, interim}}{r_\text{eff yrly} - g_\text{eff yrly}}(1+r_\text{eff yrly})^{0.5} + \frac{C_\text{1, final}}{r_\text{eff yrly} - g_\text{eff yrly}} \\ &= \frac{0.55}{0.08 - 0.04}(1+0.08)^{0.5} + \frac{0.55}{0.08 - 0.04} \\ &= 13.75(1+0.08)^{0.5} + 13.75 \\ &= 14.28941916 + 13.75 \\ &= 28.03941916 \\ \end{aligned}###
Note that nominal cash flows can be discounted by nominal discount rates to give a correct valuation without any problem. It is only important to discount nominal cash flows by nominal discount rates and real cash flows by real discount rates. Both methods should give the same answer.
Method 2: Single perpetuity of a year's payments.
Make a perpetuity out of the future value of the first interim dividend in 6 months plus the first annual dividend in one year. Use this dividend value inside the perpetuity with growth equation.
###\begin{aligned} P_0 &= \frac{C_{1\text{, dividends over first year}}}{r-g} \\ &= \frac{C_\text{0.5, interim dividend}(1+r)^{0.5} + C_\text{1, final dividend}}{r-g} \\ &= \frac{0.55(1+0.08)^{0.5} + 0.55}{0.08-0.04} \\ &= \frac{1.121576766}{0.08-0.04} \\ &= 28.03941916 \\ \end{aligned}###
Question 535 DDM, real and nominal returns and cash flows, stock pricing
You are an equities analyst trying to value the equity of the Australian telecoms company Telstra, with ticker TLS. In Australia, listed companies like Telstra tend to pay dividends every 6 months. The payment around August is called the final dividend and the payment around February is called the interim dividend. Both occur annually.
- Today is mid-March 2015.
- TLS's last interim dividend of $0.15 was one month ago in mid-February 2015.
- TLS's last final dividend of $0.15 was seven months ago in mid-August 2014.
Judging by TLS's dividend history and prospects, you estimate that the nominal dividend growth rate will be 1% pa. Assume that TLS's total nominal cost of equity is 6% pa. The dividends are nominal cash flows and the inflation rate is 2.5% pa. All rates are quoted as nominal effective annual rates. Assume that each month is exactly one twelfth (1/12) of a year, so you can ignore the number of days in each month.
Calculate the current TLS share price.
The stock price is the present value of future dividends, so the old dividends before now (March 2015) should be excluded. There are two method outlines below which give the same stock price.
Method 1: Make an annual perpetuity of each dividend and then grow the prices forward to March 2015
Make a perpetuity of the annual interim dividends in August. The next one is in August 2015. This will give a price one period before, in August 2014. This price can then be grown forward 7 months to the current time, March 2015.
###\begin{aligned} P_\text{Aug 2014, Aug dividends} &= \dfrac{C_\text{Aug 2015}}{r_\text{eff annual} - g_\text{eff annual}} \\ &= \dfrac{C_{\text{Aug }\mathbf{2014}}(1+g_\text{eff annual})^1}{r_\text{eff annual} - g_\text{eff annual}} \\ &= \dfrac{0.15(1+0.01)^1}{0.06 - 0.01} \\ &= 3.03 \\ \end{aligned}### ###\begin{aligned} P_\text{Mar 2015, Aug dividends} &= P_\text{Aug 2014, Aug dividends}(1+r_\text{eff annual})^{7/12} \\ &= 3.03(1+0.06)^{7/12} \\ &= 3.134760626 \\ \end{aligned}###Make a perpetuity of the annual interim dividends in February. The next one is in February 2016. This will give a price one period before, in February 2015. This price can then be grown forward 1 month to the current time, March 2015.
###\begin{aligned} P_\text{Feb 2015, Feb dividends} &= \dfrac{C_\text{Feb 2016}}{r_\text{eff annual} - g_\text{eff annual}} \\ &= \dfrac{C_{\text{Feb }\mathbf{2015}}(1+g_\text{eff annual})^1}{r_\text{eff annual} - g_\text{eff annual}} \\ &= \dfrac{0.15(1+0.01)^1}{0.06 - 0.01} \\ &= 3.03 \\ \end{aligned}### ###\begin{aligned} P_\text{Mar 2015, Feb dividends} &= P_\text{Feb 2015, Feb dividends}(1+r_\text{eff annual})^{1/12} \\ &= 3.03(1+0.06)^{1/12} \\ &= 3.044748678 \\ \end{aligned}###Note that in both cases the share price is grown forward by the total required return ##r_\text{eff annual}##, not the growth rate ##g_\text{eff annual}##. This is because in the perpetuity equation, share prices rise by the total return between dividend payments. This is apparent when looking at the 'saw-tooth' graph of expected stock prices.
The sum of the two perpetuities will give the total current share price in March 2015. It's OK to sum them since they are both at the same time.
###\begin{aligned} P_\text{Mar 2015, All Aug and Feb dividends} &= P_\text{Mar 2015, Aug dividends} + P_\text{Mar 2015, Feb dividends} \\ &= 3.134760626 + 3.044748678 \\ &= 6.179509305 \\ \end{aligned}###Method 2: Grow the dividends forward to March 2016, add them together and then make a single annual perpetuity
Note that this method is not a good way to conceptualise how stock pricing works since it doesn't make sense to artificially move dividends backward and forward. It can't be visualised on the saw-tooth graph of expected stock prices. This method only works because growing the dividends forward is mathematically equivalent to growing the price forward like we did in method 1. At the end of this explanation, the equivalence of the methods will be discussed.
Since both the interim and final dividend grow forever and at the same rate, we can combine them in the one perpetuity equation. So we'll grow the dividends forward one year ahead of the current time, which gives ##C_1## in Mar 2016, so the perpetuity equation will give us the current price, ##P_0## in Mar 2015.
###\begin{aligned} \left( \begin{array}{c} \text{Aug 2015 final dividend} \\ \text{grown forward to Mar 2016} \end{array} \right) &= C_\text{Aug 2015}(1+r_\text{eff annual})^{7/12} \\ &= C_{\text{Aug }\mathbf{2014}}(1+g_\text{eff annual})^1(1+r_\text{eff annual})^{7/12} \\ &= 0.15(1+0.01)^1(1+0.06)^{7/12} \\ &= 0.156738031 \\ \end{aligned}### ###\begin{aligned} \left( \begin{array}{c} \text{Feb 2016 final dividend} \\ \text{grown forward to Mar 2016} \end{array} \right) &= C_\text{Feb 2016}(1+r_\text{eff annual})^{1/12} \\ &= C_{\text{Feb }\mathbf{2015}}(1+g_\text{eff annual})^1(1+r_\text{eff annual})^{1/12} \\ &= 0.15(1+0.01)^1(1+0.06)^{1/12} \\ &= 0.152237434 \\ \end{aligned}### ###\begin{aligned} P_\text{0, Mar 2015} &= \dfrac{ \left( \begin{array}{c} \text{Feb 2015 dividend grown} \\ \text{forward to Mar 2016} \end{array} \right) + \left( \begin{array}{c} \text{Aug 2014 dividend grown} \\ \text{forward to Mar 2016} \end{array} \right) }{ r_\text{eff annual} - g_\text{eff annual} } \\ &= \dfrac{0.156738031+0.152237434}{0.06 - 0.01} \\ &= \dfrac{0.308975465}{0.06 - 0.01} \\ &= 6.179509305 \\ \end{aligned}###Here in method 2, the next August 2015 dividend was multiplied by ##(1+r_\text{eff annual})^{7/12}##. In method 1, the annual August dividends were priced, and this price was multiplied by ##(1+r_\text{eff annual})^{7/12}##.
Similarly for the February dividend and price in method 1 and 2 respectively, both were multiplied by ##(1+r_\text{eff annual})^{1/12}##. Because multiplying a perpetuity price is equivalent to multiplying the perpetuity's dividend, both methods give the same result. This is why method 2 works, it's due to a mathematical trick that multiplication of the price is equivalent to multiplication of the dividend. Even though in reality, it's only the price which grows by the total return between dividend payments, as can be seen in the saw-tooth graph of stock prices.
Method 1 summary: Make an annual perpetuity of each dividend and then grow the prices forward to March 2015.
###\begin{aligned} P_\text{Mar 2015} &= \dfrac{C_\text{Aug 2015}}{r_\text{eff annual} - g_\text{eff annual}}(1+r_\text{eff annual})^{7/12} + \dfrac{C_\text{Feb 2016}}{r_\text{eff annual} - g_\text{eff annual}}(1+r_\text{eff annual})^{1/12} \\ \end{aligned}###Method 2 summary: Grow the dividends forward to March 2016.
###\begin{aligned} P_\text{Mar 2015} &= \dfrac{C_\text{Aug 2015}(1+r_\text{eff annual})^{7/12}}{r_\text{eff annual} - g_\text{eff annual}} + \dfrac{C_\text{Feb 2016}(1+r_\text{eff annual})^{1/12}}{r_\text{eff annual} - g_\text{eff annual}} \\ \end{aligned}###Question 488 income and capital returns, payout policy, payout ratio, DDM
Two companies BigDiv and ZeroDiv are exactly the same except for their dividend payouts.
BigDiv pays large dividends and ZeroDiv doesn't pay any dividends.
Currently the two firms have the same earnings, assets, number of shares, share price, expected total return and risk.
Assume a perfect world with no taxes, no transaction costs, no asymmetric information and that all assets including business projects are fairly priced and therefore zero-NPV.
All things remaining equal, which of the following statements is NOT correct?
All statements are true except for statement b. BigDiv and ZeroDiv will have the same required total return into the future since returns are a proportional measure of performance. They are scaled by the starting price. Despite the fact that ZeroDiv's market value of assets, equity, share price, dividends and profit are expected to grow faster than BigDiv's, both firms' total returns will be equal to each other and unchanged through time.
Another point to note is that assets with equal risk should have equal expected total returns. Since the firms' risks are equal, their required total returns should also be equal.
Due to its higher dividends, BigDiv will have a lower capital return than ZeroDiv (statement a), and ZeroDiv's asset value and share price will grow faster than BigDiv's (statements c and d). This is because ZeroDiv will have more money available to re-invest in more assets to generate more money, whereas BigDiv won't since it pays out high dividends.
BigDiv has a higher payout ratio than ZeroDiv (statement e) because it pays higher dividends. ##\text{Payout ratio} = (\text{total dividends})/(\text{net income})##
A stock is expected to pay a dividend of $15 in one year (t=1), then $25 for 9 years after that (payments at t=2 ,3,...10), and on the 11th year (t=11) the dividend will be 2% less than at t=10, and will continue to shrink at the same rate every year after that forever. The required return of the stock is 10%. All rates are effective annual rates.
What is the price of the stock now?
Estimate the US bank JP Morgan's share price using a price earnings (PE) multiples approach with the following assumptions and figures only:
- The major US banks JP Morgan Chase (JPM), Citi Group (C) and Wells Fargo (WFC) are comparable companies;
- JP Morgan Chase's historical earnings per share (EPS) is $4.37;
- Citi Group's share price is $50.05 and historical EPS is $4.26;
- Wells Fargo's share price is $48.98 and historical EPS is $3.89.
Note: Figures sourced from Google Finance on 24 March 2014.
The average of Citi and Wells Fargo's back-looking PE ratio multiplied by JP Morgan's EPS gives a backward-looking PE multiple valuation of JP Morgan's stock price:
###\begin{aligned} P_\text{0,JPM} &= \dfrac{ \left( \dfrac{P_\text{0,C}}{EPS_\text{0,C}} + \dfrac{P_\text{0,WFC}}{EPS_\text{0,WFC}} \right) }{2}.EPS_\text{0,JPM} \\ &= \dfrac{ \left( \dfrac{50.05}{4.26} + \dfrac{48.98}{3.89} \right) }{2} \times 4.37 \\ &= \dfrac{ \left(11.74882629 + 12.59125964 \right) }{2} \times 4.37 \\ &= 12.17004297 \times 4.37 \\ &= 53.18308776 \\ \end{aligned}###JP Morgan's share price actually closed at $61.07 on 24 March 2014 so the PE ratio valuation approach gives a number in the right ball park.
Since the actual market traded price of $61.07 is higher than the estimated price of $53.18 based on similar firms, JP Morgan stock might be over-priced and therefore should be sold. Or, perhaps JP Morgan has higher expected future growth potential or lower systematic risk compared to its peers so it's fairly priced or even under-priced after taking these factors into account.
Estimate Microsoft's (MSFT) share price using a price earnings (PE) multiples approach with the following assumptions and figures only:
- Apple, Google and Microsoft are comparable companies,
- Apple's (AAPL) share price is $526.24 and historical EPS is $40.32.
- Google's (GOOG) share price is $1,215.65 and historical EPS is $36.23.
- Micrsoft's (MSFT) historical earnings per share (EPS) is $2.71.
Source: Google Finance 28 Feb 2014.
The average of Apple and Google's back-looking PE ratio multiplied by Microsft's EPS gives a backward-looking PE multiple valuation of Microsoft's stock price:
###\begin{aligned} P_\text{0,MSFT} &= \dfrac{ \left( \dfrac{P_\text{0,AAPL}}{EPS_\text{0,AAPL}} + \dfrac{P_\text{0,GOOG}}{EPS_\text{0,GOOG}} \right) }{2}.EPS_\text{0,MSFT} \\ &= \dfrac{ \left( \dfrac{526.24}{40.32} + \dfrac{1,215.65}{36.23} \right) }{2} \times 2.71 \\ &= \dfrac{ \left(13.0515873 + 33.55368479 \right) }{2} \times 2.71 \\ &= 23.30263605 \times 2.71 \\ &= 63.15014369 \\ \end{aligned}###Microsoft's share price was actually $38.31 so the PE ratio valuation approach is not doing a good job. This is probably because Google and Apple are not similar enough to Microsoft. Microsoft is an older and more mature company with lower growth prospects than either of the other two software companies.
Question 180 equivalent annual cash flow, inflation, real and nominal returns and cash flows
Details of two different types of light bulbs are given below:
- Low-energy light bulbs cost $3.50, have a life of nine years, and use about $1.60 of electricity a year, paid at the end of each year.
- Conventional light bulbs cost only $0.50, but last only about a year and use about $6.60 of energy a year, paid at the end of each year.
The real discount rate is 5%, given as an effective annual rate. Assume that all cash flows are real. The inflation rate is 3% given as an effective annual rate.
Find the Equivalent Annual Cost (EAC) of the low-energy and conventional light bulbs. The below choices are listed in that order.
This is an equivalent annual cost question because the two different types of light bulb last for different amounts of time.
Since the cash flows and discount rate are real, we can apply present value techniques without needing to worry about inflation. If the cash flows and discount rate were nominal, inflation can also be ignored. It's only when the cash flows are real and the discount rate is nominal (or vice versa) that you have to convert the nominal discount rate to a real rate using the Fisher equation. So in this question, there is no need to do this and the inflation figure of 3% is a red herring.
###\begin{aligned} V_\text{0, low energy} &= C_0 + \frac{C_\text{1,2,...T}}{r} \left(1-\frac{1}{(1+r)^{T}} \right) \\ &= 3.50 + \frac{1.60}{0.05} \left(1-\frac{1}{(1+0.05)^{9}} \right) \\ &= 14.87251468\\ \end{aligned} ###
###\begin{aligned} V_\text{0, conventional} &= C_0 + \frac{C_\text{1}}{(1+r)^1} \\ &= 0.50 + \frac{6.60}{(1+0.05)^1} \\ &= 6.785714286 \\ \end{aligned} ###
The conventional light bulb appears cheaper because it has a lower present value of costs, but we have to recognise that it has a shorter life, so of course the present value of costs will be less. We need to use the annuity formula to spread the costs over each light bulb's life so we can get an equivalent annual cost.
For the low energy light bulb that lasts for 9 years:
###V_\text{0, low energy} = \frac{C_\text{EAC low energy}}{r} \left(1-\frac{1}{(1+r)^{T}} \right) ### ###14.87251468 = \frac{C_\text{EAC low energy}}{0.05} \left(1-\frac{1}{(1+0.05)^{9}} \right) ### ##C_\text{EAC low energy} = 2.09241528 ##For the conventional light bulb that lasts for 1 year:
###V_\text{0, conventional} = \frac{C_\text{EAC conventional}}{r} \left(1-\frac{1}{(1+r)^{T}} \right) ### ###6.785714286 = \frac{C_\text{EAC conventional}}{0.05} \left(1-\frac{1}{(1+0.05)^{1}} \right) ### ###C_\text{EAC conventional} = 7.125 ###Since the low energy light bulb has the lower equivalent annual cost, it is the best choice.
Carlos and Edwin are brothers and they both love Holden Commodore cars.
Carlos likes to buy the latest Holden Commodore car for $40,000 every 4 years as soon as the new model is released. As soon as he buys the new car, he sells the old one on the second hand car market for $20,000. Carlos never has to bother with paying for repairs since his cars are brand new.
Edwin also likes Commodores, but prefers to buy 4-year old cars for $20,000 and keep them for 11 years until the end of their life (new ones last for 15 years in total but the 4-year old ones only last for another 11 years). Then he sells the old car for $2,000 and buys another 4-year old second hand car, and so on.
Every time Edwin buys a second hand 4 year old car he immediately has to spend $1,000 on repairs, and then $1,000 every year after that for the next 10 years. So there are 11 payments in total from when the second hand car is bought at t=0 to the last payment at t=10. One year later (t=11) the old car is at the end of its total 15 year life and can be scrapped for $2,000.
Assuming that Carlos and Edwin maintain their love of Commodores and keep up their habits of buying new ones and second hand ones respectively, how much larger is Carlos' equivalent annual cost of car ownership compared with Edwin's?
The real discount rate is 10% pa. All cash flows are real and are expected to remain constant. Inflation is forecast to be 3% pa. All rates are effective annual. Ignore capital gains tax and tax savings from depreciation since cars are tax-exempt for individuals.
This is an equivalent annual cost question. There are two steps, first find the NPV of costs over the life of each car, then spread these costs over the life using the annuity formula to find the equivalent annual cost.
Carlos buys the new car that he keeps for 4 years and Edwin buys the older car which he keeps for 11 years. First find the NPV of the costs of each car.
Note that a revenue is a negative cost. If that's confusing, then find the equivalent annual benefit, so costs are negative and revenues are positive which is arguably more intuitive. The numerical answers will be the same, but the signs will be switched around.
###\begin{aligned} V_\text{0, Carlos} &= C_0 - \frac{C_4}{(1+0.1)^4} \\ &= 40,000 - \frac{20,000}{(1+0.1)^4} \\ &= 26,339.73089 \\ \end{aligned} ###
###\begin{aligned} V_\text{0, Edwin} &= C_0 + \frac{C_\text{0,1,...10}}{r} \left(1-\frac{1}{(1+r)^{11}} \right)(1+r)^1 - \frac{C_{11}}{(1+r)^{11}} \\ &= 20,000 + \frac{1,000}{0.1} \left(1-\frac{1}{(1+0.1)^{11}} \right)(1+0.1)^1 - \frac{2,000}{(1+0.1)^{11}} \\ &= 26,443.57931 \\ \end{aligned} ###
Now spread the costs over the life of each car using the annuity formula. This will give the 'equivalent annual cost'.
###V_\text{0, Carlos} = \frac{C_\text{EAC Carlos}}{r} \left(1-\frac{1}{(1+r)^{T}} \right) ### ###26,339.73089 = \frac{C_\text{EAC Carlos}}{0.1} \left(1-\frac{1}{(1+0.1)^{4}} \right) ### ###C_\text{EAC Carlos} = 8,309.416074 ###Now for Edwin:
###V_\text{0, Edwin} = \frac{C_\text{EAC Edwin}}{r} \left(1-\frac{1}{(1+r)^{T}} \right) ### ###26,443.57931 = \frac{C_\text{EAC Edwin}}{0.1} \left(1-\frac{1}{(1+0.1)^{11}} \right) ### ###C_\text{EAC Edwin} = 4,071.336556 ###To find how much larger Carlos' equivalent annual cost is compared with Edwin:
###\begin{aligned} C_\text{difference} &= C_\text{EAC Carlos} - C_\text{EAC Edwin} \\ &= 8,309.416074 - 4,071.336556 \\ &= 4,238.079518 \\ \end{aligned} ###
Therefore Carlos spends $4,238 more than Edwin per year, as an equivalent end-of-year cost.You own a nice suit which you wear once per week on nights out. You bought it one year ago for $600. In your experience, suits used once per week last for 6 years. So you expect yours to last for another 5 years.
Your younger brother said that retro is back in style so he wants to wants to borrow your suit once a week when he goes out. With the increased use, your suit will only last for another 4 years rather than 5.
What is the present value of the cost of letting your brother use your current suit for the next 4 years?
Assume: that bank interest rates are 10% pa, given as an effective annual rate; you will buy a new suit when your current one wears out and your brother will not use the new one; your brother will only use your current suit so he will only use it for the next four years; and the price of a new suit never changes.
By letting your brother use the suit, it will wear out 1 year earlier. The one year of additional cost should be found using the annuity formula, called the 'equivalent annual cost' (EAC) method:
###\begin{aligned} V_0 &= C_1\times \frac{1}{r}\left(1-\frac{1}{(1+r)^T}\right) \\ 600 &= EAC_1\times \frac{1}{0.1}\left(1-\frac{1}{(1+0.1)^6}\right) \\ EAC_1 &= 600 \div \left( \frac{1}{0.1}\left(1-\frac{1}{(1+0.1)^6}\right) \right)\\ &= 600 \div 4.355260699 \\ &= 137.7644282 \\ \end{aligned} ###
Note that this is not equal to just dividing the cost of the suit ($600) by how long it lasts (6yrs) which is $100. This is because $600 now is a higher cost in present value terms than $100 received at the end of each year for 6 years. Dividing the cost by the total time doesn't take the time value of money into account.
In 4 yrs you will have to buy another suit at a cost of $600 (at t=4). The one year of additional cost is the equivalent annual cost just calculated. But we have to be careful since the annuity equation used to find the EAC actually gives a figure one year ahead (##EAC_1##) of the price now (##V_0##). So even though the new suit will need to be bought at t=4, the EAC is actually one period ahead at t=5. So the present value of this additional cost is:
###\begin{aligned} V_\text{0, additional cost} &= \frac{EAC_5}{(1+r)^5} \\ &= \frac{137.7644282}{(1+0.1)^5} \\ &= 85.54087104 \\ \end{aligned} ###
This is the present value of the additional cost of letting your brother use the suit.
You own some nice shoes which you use once per week on date nights. You bought them 2 years ago for $500. In your experience, shoes used once per week last for 6 years. So you expect yours to last for another 4 years.
Your younger sister said that she wants to borrow your shoes once per week. With the increased use, your shoes will only last for another 2 years rather than 4.
What is the present value of the cost of letting your sister use your current shoes for the next 2 years?
Assume: that bank interest rates are 10% pa, given as an effective annual rate; you will buy a new pair of shoes when your current pair wears out and your sister will not use the new ones; your sister will only use your current shoes so she will only use it for the next 2 years; and the price of new shoes never changes.
By letting your sister use the shoes, it will wear out 2 years earlier. Each year of additional cost should be found using the annuity formula, called the 'equivalent annual cost' (EAC) method:
###\begin{aligned} V_0 &= C_1\times \frac{1}{r}\left(1-\frac{1}{(1+r)^T}\right) \\ 500 &= EAC_1\times \frac{1}{0.1}\left(1-\frac{1}{(1+0.1)^6}\right) \\ EAC_1 &= 500 \div \left( \frac{1}{0.1}\left(1-\frac{1}{(1+0.1)^6}\right) \right)\\ &= 500 \div 4.355260699 \\ &= 114.8036902 \\ \end{aligned} ###
Note that this is not equal to just dividing the cost of the shoes ($500) by how long it lasts (6yrs) which is $83.33. This is because $500 now is a higher cost in present value terms than $83.33 received at the end of each year for 6 years. Dividing the cost by the total time doesn't take the time value of money into account.
In 2 yrs you will have to buy another pair of shoes at a cost of $500 (at t=2), 2 years sooner than you budgeted. The two years of additional costs can be calculated using the equivalent annual cost just found. But we have to be careful since the annuity equation used to find the EAC actually gives a figure one year ahead (##EAC_1##) of the price now (##V_0##). So even though the new shoes will need to be bought at t=2, the EAC's will occur one year later at t=3, then 4. Another way of thinking about it is that the EAC's are paid 'in arrears' for the year elapsed before they are paid, so the payment at t=3 covers the extra cost of not being able to use the old shoes between t=2 and 3, and the payment at t=4 covers that cost between t=3 and 4. The present value of these two additional costs is:
###\begin{aligned} V_\text{0, additional costs} &= \frac{EAC_3}{(1+r)^3} + \frac{EAC_4}{(1+r)^4} \\ &= \frac{114.8036902 }{(1+0.1)^3} + \frac{114.8036902 }{(1+0.1)^4} \\ &= 164.6661768 \\ \end{aligned} ###
This is the present value of the additional cost of letting your sister use the shoes. Notice that even though the shoes' expected life is 1/3 shorter, the additional cost is not 1/3 the value of the shoes ($166.67) or even the present value if we assume the $166.67 is paid in 2 years ($137.74) since neither of these methods take the time value of money into account properly.
An industrial chicken farmer grows chickens for their meat. Chickens:
- Cost $0.50 each to buy as chicks. They are bought on the day they’re born, at t=0.
- Grow at a rate of $0.70 worth of meat per chicken per week for the first 6 weeks (t=0 to t=6).
- Grow at a rate of $0.40 worth of meat per chicken per week for the next 4 weeks (t=6 to t=10) since they’re older and grow more slowly.
- Feed costs are $0.30 per chicken per week for their whole life. Chicken feed is bought and fed to the chickens once per week at the beginning of the week. So the first amount of feed bought for a chicken at t=0 costs $0.30, and so on.
- Can be slaughtered (killed for their meat) and sold at no cost at the end of the week. The price received for the chicken is their total value of meat (note that the chicken grows fast then slow, see above).
The required return of the chicken farm is 0.5% given as an effective weekly rate.
Ignore taxes and the fixed costs of the factory. Ignore the chicken’s welfare and other environmental and ethical concerns.
Find the equivalent weekly cash flow of slaughtering a chicken at 6 weeks and at 10 weeks so the farmer can figure out the best time to slaughter his chickens. The choices below are given in the same order, 6 and 10 weeks.
This is an equivalent periodic cash flow (sometimes called equivalent annual cost) question since the chickens can have different life times. The first step is to find the present value of the gain from slaughtering the chickens when they are 6 weeks old and also at 10 weeks old, then in the second step we spread these gains over 6 and 10 weeks using the annuity formula. The best time to slaughter a poor chicken will be at whichever time gives the highest equivalent weekly cash flow.
Note that the increase in chicken meat occurs at the end of each week, but you can't chop off bits of the chicken and sell it each week without killing the poor thing! So the increase in the amount of meat is all received at the end when the chicken is slaughtered.
###\begin{aligned} V_\text{0, 6 weeks} &= -C_\text{0, hatchling} + \frac{-C_\text{0,1,2,...5, feed}}{r} \left(1-\frac{1}{(1+r)^{6}} \right)(1+r)^1 + \frac{6 \times C_\text{6, young meat}}{(1+r)^6} \\ &= -0.50 + \frac{-0.30}{0.005} \left(1-\frac{1}{(1+0.005)^{6}} \right)(1+0.005)^1 + \frac{6 \times 0.70}{(1+0.005)^6} \\ &= 1.798416029 \\ \end{aligned} ###
###\begin{aligned} V_\text{0, 10 weeks} &= -C_\text{0, hatchling} + \frac{-C_\text{0,1,2,...9, feed}}{r} \left(1-\frac{1}{(1+r)^{10}} \right)(1+r)^1 + \\ &\frac{6 \times C_\text{10, young meat} + (10-6) \times C_\text{10, old meat}}{(1+r)^{10}} \\ &= -0.50 + \frac{-0.30}{0.005} \left(1-\frac{1}{(1+0.005)^{10}} \right)(1+0.005)^1 + \frac{6 \times 0.70 + 4 \times 0.40}{(1+0.005)^{10}} \\ &= 2.08409888 \\ \end{aligned} ###
It looks like the chickens should be allowed to live! But remember that the chickens have different lives. It is too early to draw a conclusion, we must find the equivalent weekly cash flow from letting them live for 6 and 10 weeks and then make a decision.
For the 6 week old chickens,
###\begin{aligned} V_\text{0, 6 weeks} &= \frac{C_\text{EWC 6 weeks}}{r} \left(1-\frac{1}{(1+r)^{T}} \right) \\ 1.798416029 &= \frac{C_\text{EWC 6 weeks}}{0.005} \left(1-\frac{1}{(1+0.005)^{6}} \right) \\ C_\text{EWC 6 weeks} &= 0.305003186 \\ \end{aligned} ###
For the 10 week old chickens,
###\begin{aligned} V_\text{0, 10 weeks} &= \frac{C_\text{EWC 10 weeks}}{r} \left(1-\frac{1}{(1+r)^{T}} \right) \\ 2.08409888 &= \frac{C_\text{EWC 10 weeks}}{0.005} \left(1-\frac{1}{(1+0.005)^{10}} \right) \\ C_\text{EWC 10 weeks} &= 0.214184036 \\ \end{aligned} ###
Since the 6 week old chickens have the highest equivalent weekly cash flow, it is best to slaughter the chickens young. This is in fact what happens in commercial chicken meat farms, chickens are killed at 6 weekssource.
You may think that it doesn't make economic sense to kill them so young because they eat $0.30 of food but put on $0.40 of weight per week, so there is a gain for every extra week that the chickens are alive, which is true. But the opportunity cost of the feeding an old chicken that grows slowly is feeding a new younger chicken that grows quickly. Chicken farmers can make bigger gains per chicken by killing them young. Economically that makes better sense. But of course this ignores some ethical dilemmas raised by this train of thought.