A share was bought for $10 (at t=0) and paid its annual dividend of $0.50 one year later (at t=1). Just after the dividend was paid, the share price was $11 (at t=1).
What was the total return, capital return and income return? Calculate your answers as effective annual rates. The choices are given in the same order:
##r_\text{total}##, ##r_\text{capital}##, ##r_\text{dividend}##.
Which of the below statements about effective rates and annualised percentage rates (APR's) is NOT correct?
Which of the following investable assets are NOT suitable for valuation using PE multiples techniques?
A company advertises an investment costing $1,000 which they say is underpriced. They say that it has an expected total return of 15% pa, but a required return of only 10% pa. Assume that there are no dividend payments so the entire 15% total return is all capital return.
Assuming that the company's statements are correct, what is the NPV of buying the investment if the 15% return lasts for the next 100 years (t=0 to 100), then reverts to 10% pa after that time? Also, what is the NPV of the investment if the 15% return lasts forever?
In both cases, assume that the required return of 10% remains constant. All returns are given as effective annual rates.
The answer choices below are given in the same order (15% for 100 years, and 15% forever):
Question 770 expected and historical returns, income and capital returns, coupon rate, bond pricing
Which of the following statements is NOT correct? Assume that all events are a surprise and that all other things remain equal. So for example, don't assume that just because a company's dividends and profit rise that its required return will also rise, assume the required return stays the same.
Use the below information to value a levered company with annual perpetual cash flows from assets that grow. The next cash flow will be generated in one year from now. Note that ‘k’ means kilo or 1,000. So the $30k is $30,000.
| Data on a Levered Firm with Perpetual Cash Flows | ||
| Item abbreviation | Value | Item full name |
| ##\text{OFCF}## | $30k | Operating free cash flow |
| ##g## | 1.5% pa | Growth rate of OFCF |
| ##r_\text{D}## | 4% pa | Cost of debt |
| ##r_\text{EL}## | 16.3% pa | Cost of levered equity |
| ##D/V_L## | 80% pa | Debt to assets ratio, where the asset value includes tax shields |
| ##t_c## | 30% | Corporate tax rate |
| ##n_\text{shares}## | 100k | Number of shares |
Which of the following statements is NOT correct?
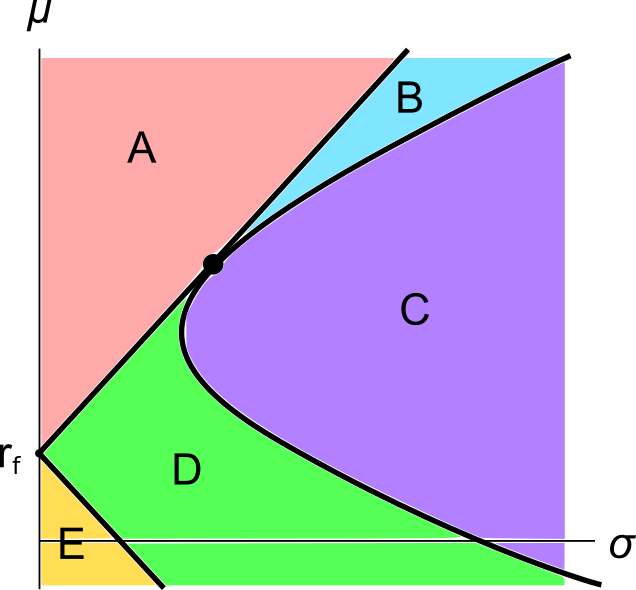
A graph of assets’ expected returns ##(\mu)## versus standard deviations ##(\sigma)## is given in the below diagram.
Each letter corresponds to a separate coloured area. The portfolios at the boundary of the areas, on the black lines, are excluded from each area. Assume that all assets represented in this graph are fairly priced, and that all risky assets can be short-sold.
Which of the following statements about this graph and Markowitz portfolio theory is NOT correct?