A stock is expected to pay the following dividends:
| Cash Flows of a Stock | ||||||
| Time (yrs) | 0 | 1 | 2 | 3 | 4 | ... |
| Dividend ($) | 0.00 | 1.00 | 1.05 | 1.10 | 1.15 | ... |
After year 4, the annual dividend will grow in perpetuity at 5% pa, so;
- the dividend at t=5 will be $1.15(1+0.05),
- the dividend at t=6 will be $1.15(1+0.05)^2, and so on.
The required return on the stock is 10% pa. Both the growth rate and required return are given as effective annual rates.
What will be the price of the stock in three and a half years (t = 3.5)?
You operate a cattle farm that supplies hamburger meat to the big fast food chains. You buy a lot of grain to feed your cattle, and you sell the fully grown cattle on the livestock market.
You're afraid of adverse movements in grain and livestock prices. What options should you buy to hedge your exposures in the grain and cattle livestock markets?
Select the most correct response:
The following equation is the Dividend Discount Model, also known as the 'Gordon Growth Model' or the 'Perpetuity with growth' equation.
###p_0=\frac{d_1}{r_\text{eff}-g_\text{eff}}###
Which expression is NOT equal to the expected capital return?
Two years ago Fred bought a house for $300,000.
Now it's worth $500,000, based on recent similar sales in the area.
Fred's residential property has an expected total return of 8% pa.
He rents his house out for $2,000 per month, paid in advance. Every 12 months he plans to increase the rental payments.
The present value of 12 months of rental payments is $23,173.86.
The future value of 12 months of rental payments one year ahead is $25,027.77.
What is the expected annual growth rate of the rental payments? In other words, by what percentage increase will Fred have to raise the monthly rent by each year to sustain the expected annual total return of 8%?
A fairly valued share's current price is $4 and it has a total required return of 30%. Dividends are paid annually and next year's dividend is expected to be $1. After that, dividends are expected to grow by 5% pa in perpetuity. All rates are effective annual returns.
What is the expected dividend income paid at the end of the second year (t=2) and what is the expected capital gain from just after the first dividend (t=1) to just after the second dividend (t=2)? The answers are given in the same order, the dividend and then the capital gain.
The below screenshot of Commonwealth Bank of Australia's (CBA) details were taken from the Google Finance website on 7 Nov 2014. Some information has been deliberately blanked out.
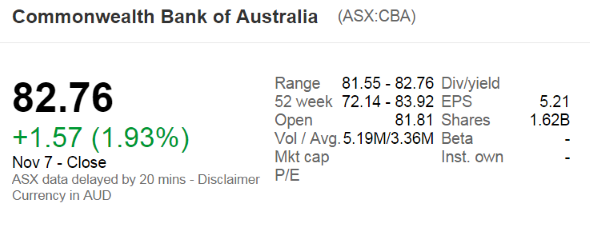
What was CBA's backwards-looking price-earnings ratio?
Question 710 continuously compounding rate, continuously compounding rate conversion
A continuously compounded monthly return of 1% ##(r_\text{cc monthly})## is equivalent to a continuously compounded annual return ##(r_\text{cc annual})## of:
Use the below information to value a levered company with constant annual perpetual cash flows from assets. The next cash flow will be generated in one year from now, so a perpetuity can be used to value this firm. Both the operating and firm free cash flows are constant (but not equal to each other).
| Data on a Levered Firm with Perpetual Cash Flows | ||
| Item abbreviation | Value | Item full name |
| ##\text{OFCF}## | $48.5m | Operating free cash flow |
| ##\text{FFCF or CFFA}## | $50m | Firm free cash flow or cash flow from assets |
| ##g## | 0% pa | Growth rate of OFCF and FFCF |
| ##\text{WACC}_\text{BeforeTax}## | 10% pa | Weighted average cost of capital before tax |
| ##\text{WACC}_\text{AfterTax}## | 9.7% pa | Weighted average cost of capital after tax |
| ##r_\text{D}## | 5% pa | Cost of debt |
| ##r_\text{EL}## | 11.25% pa | Cost of levered equity |
| ##D/V_L## | 20% pa | Debt to assets ratio, where the asset value includes tax shields |
| ##t_c## | 30% | Corporate tax rate |
What is the value of the levered firm including interest tax shields?
Which Australian institution is in charge of monetary policy?
Question 976 comparative advantage in trade, production possibilities curve, no explanation
Arthur and Bindi are the only people on a remote island. Their production possibility curves are shown in the graph.
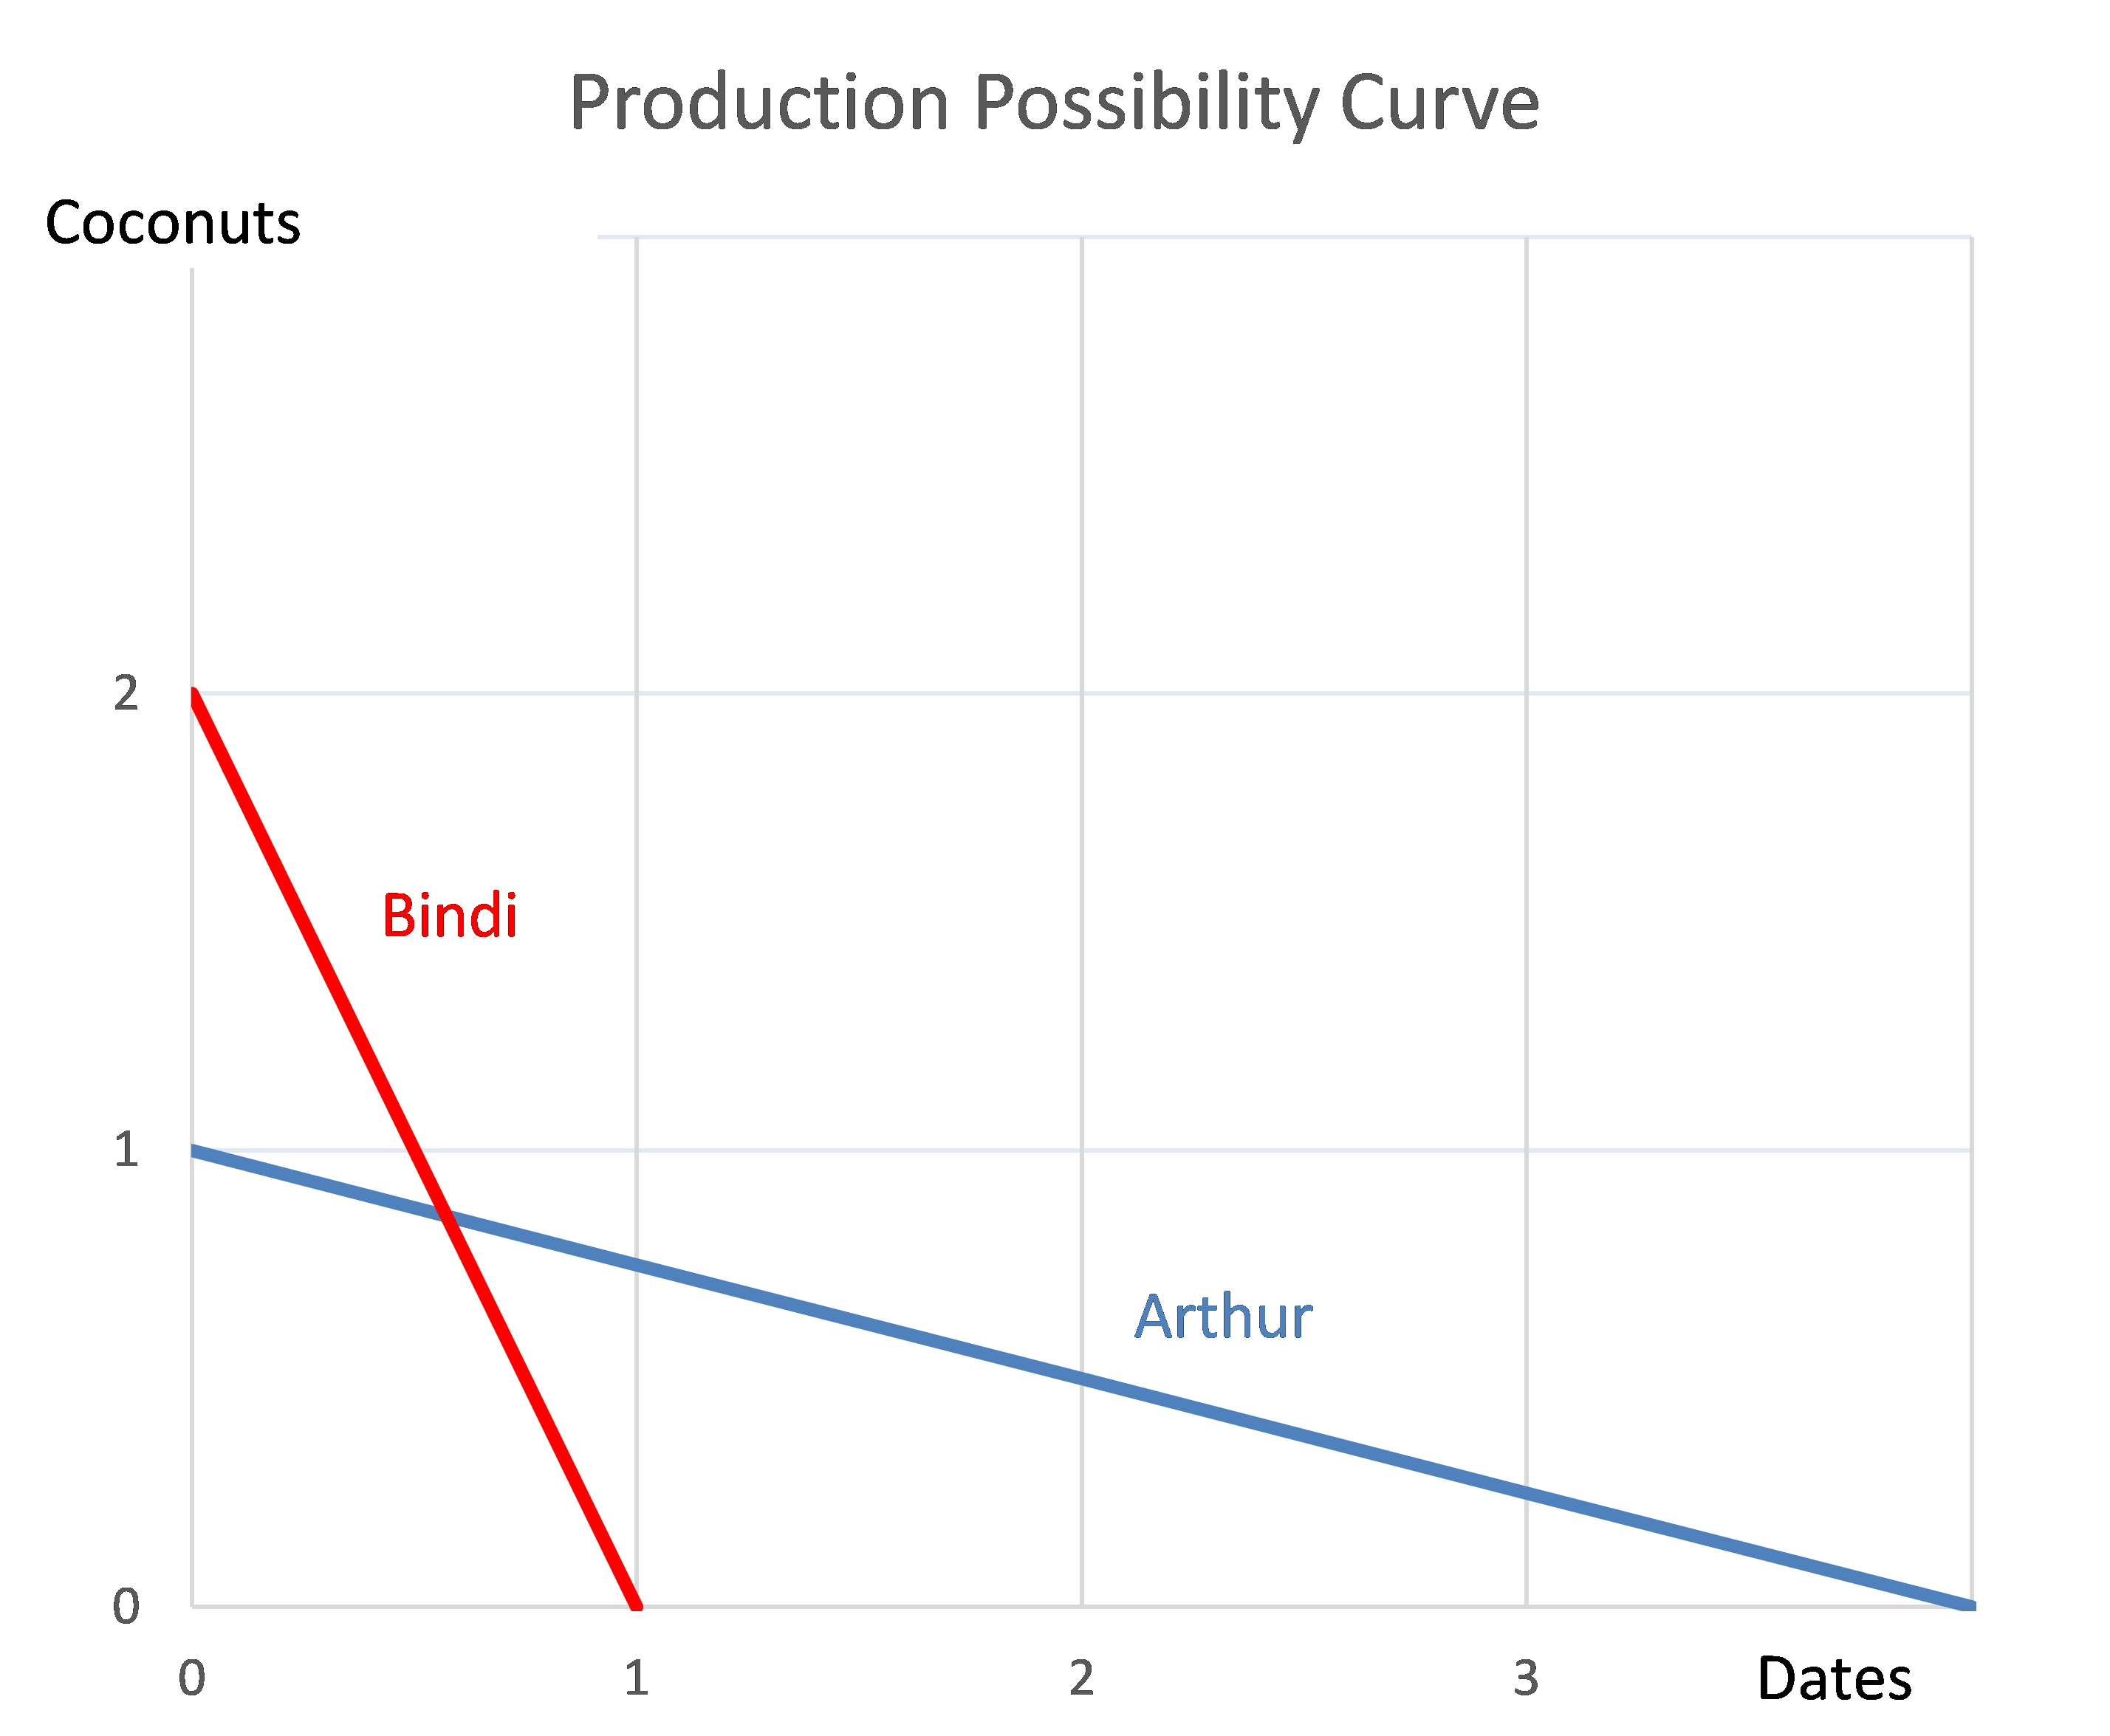
Which of the following statements is NOT correct?